Data Science Principles Assignment Sample
Explore comprehensive data science principles through practical infrastructure design, interactive Power BI analytics, statistical hypothesis testing, and essential legal and ethical frameworks.
- 92650+ Project Delivered
- 1500+ Experts 24x7 Online Help
- No AI Generated Content
- Introduction Of Data Science Principles Assignment
- Part 1 -The Design of the Infrastructure
- Infrastructure Design and Justification
- Data Storage and Harnessing for Analysis
- Part 2 - the Development of a Demonstrable Artefact
- Outline of the Development of the Artefact
- Development and Structure of the Analytics Dataset
- Evaluation of the Artefact
- Part 3 -The Testing of a Hypothesis
- Testing
- Bar Chart
- Waterfall Chart
- Tree Map
- Pie Chart
- Donut Chart
- Part 4 -Legal and Ethical Discussion
- Legal Considerations
- Ethical Considerations
- Future Considerations with Machine Learning
Introduction Of Data Science Principles Assignment
Analytics is a main component of the management and of the contemporary business models, in which companies get valuable and effective information to increase their performance and profitability. The challenge that has been addressed in this report is the one of leveraging transactional data to identify trends in spending, including across regions and across products. The business opportunity is to harness this knowledge to better understand stock, advertising and promotional profiles in order to devise more effective customer interaction plans. Through the use of analytics, the organization seeks to turn data into insights to help create a competitive edge given the growing and improving market competition. The tasks performed in this report are divided exclusively for architecture and constructions of a strong data support system, creation of a viable analytical instrument, and performance of a hypothesis checking activity for assessing the purchasing behavior. The infrastructure is designed to work with both legacy and large, complex datasets to accommodate its scale with relative ease. The artefact was created using Power BI, a BI tool, to consume, analyze and report structured data in tabular format. The hypothesis testing used the artefact to work with different trends of the buying behavior and illustrated them statistically as well as by means of a graph. For convenience and clarity, the report has been split into four major headings. Part one focuses on the design of the data infrastructure explaining how the organization uses both traditional and big data processing to address analytical requirements. Part 2 looks into the process of creating the artefact, explaining how raw data was analyzed to produce an interactive analytical instrument. In Part 3, discuss how to use several Power BI graphics to implement a hypothesis and reveal purchasing patterns and tendencies. Last, in Part 4 present the legal and ethical issues with regards to data management, analysis, and an outlook of incorporating machine learning in the future. As the context of this report, the focus made is towards the development of a scalable and ethical data solution that would support organizational objectives. Mitigating such data-related issues at the architectural level and using superior data visualization techniques enable the organization to fully leverage its data in furnishing solutions to strategic plans. This report provides a complete reference for how to construct methods for analysis, software for analysis, and assessment at the same time refer to legal and ethical concerns, which will benefit the permanent development of business.
Say goodbye to academic pressure! New Assignment Help is your go-to partner for expert-level Best Assignment Help in the UK.
Part 1 -The Design of the Infrastructure
This paper will utilize the provided dataset and Power BI tools to design the structure of infrastructure to handle both the conventional and big data processing and analysis. This design provides for scalability, and workflow in terms of integration for data analysis and presentation.
Infrastructure Design and Justification
An Excel spreadsheet structured dataset is used at the current design coupled with power BI as the analytical tool, making it quite scalable. This not only means that big data tools could be incorporated in the future when needed but also that making the change from the traditional data management in the future would be relatively easy. Data acquisition process starts with Power BI in which the structured data set comprising of customer number, purchase value and date are imported into the Power BI model. This has made the ETL (Extract , Transform and Load) process easy since Excel is used in preparing the data (Divakaran, 2022). The next section in the Power BI is called Power Query, where you are able to load data, remove errors, delete extra copies of records, and normalize fields as well as calculate new columns known as ‘total revenue,’ all of which can be ascertained by using the ‘quantity’ multiplied by ‘price per unit.’ The architecture will grow with it in the future to accommodate the increase in patients. Although the current data is feasible, Power BI’s connectivity with other data stores or the main data warehouses or data lakes guarantees that the systems can accommodate expanded data or even NoSQL log data or JSON files. For enriching the experience as well as improving the performance, Power BI provides a VertiPaq engine that provides a much faster query mechanism and data processing capability. It also maximises data storage and the work done on them, thus requiring little of what is known as ETL tools. This enables the system to be efficient in handling small as well as large data volumes thus enabling the organization in the future deal with future large volumes of data (Cady, 2024). This is because Power BI allows for direct interface with Excel, the user interface is friendly and the solution sets high standards in analytics. Its storage is through the VertiPaq engine, which makes data query and analysis fast and efficient. Integrating data directly from its source and processing in Power BI saves the time that would have been used by ETL tools for data preparation. As observed in the influence of the current data set, the system is scalable as it is built with flexible architecture with the aim of integrating large Power BI databases or cloud based storages. This leads to the ability of the organization to manage big data in the future (Yu and Singh, 2022). In general, the infrastructure design focuses on the aspects related to optimization, extensibility, and simplicity that makes it possible for the system to work with routine and large data. In this connection, Power BI is at the center of data management and used as a starting and ending point for any analytical requirements.
Data Storage and Harnessing for Analysis
These processes, which are mostly involved in data storage and analysis, are made to work optimally and the above scaling would be efficient in meeting future growth needs. It also has the crucial function as unique source of storage and analysis of the dataset because it relies of in-memory models and offers more sophisticated analytical capacities. Once data is in Power BI, it is loaded into data model and stored using VertiPaq engine in it and then following formula which is a disk based in-memory storage system which compresses the data and reduces its space utilization while it continues to allow fast access because it uses in-memory models and provides deeper analytical functionality (Wickham et al.2023). Once data is in Power BI, it is loaded into data model and stored using VertiPaq engine in it and in the following formula which is a disk based in-memory storage system which compresses data making it use less space while it continues to enjoy fast access. For instance, the sample data which is in attributes including the customer ID, product details, and time of transaction etc. does not have other means of databases by which can be uploaded directly into Power BI. For the correct working and managing of every data, star schema is implemented in power BI data model (Belle and Papantonis, 2021). In fact tables, the data to be managed are measured values such as the amount of sales and/or quantity in dimension tables the data managed can be things like customer’s name or product categories. This design improves the performance of queries, and makes the data mappable, transformable and analyzable. If the amount of data grows, or if the data is unstructured, Power BI offers the option of connecting to other storage spaces or cloud data storage or data warehouses. This makes it possible for the infrastructure to process semi-structured, or unstructured data together with structured data. To analyze the dataset, the analytical strength of Power BI is utilized. Data cleaning and transformation is the first step of the process in Power Query Editor. Here basic data preparation works like how to tackle with missing values, how to deal with duplicates and derived features or calculated fields are generated here. For instance, the profit margin can be computed as an aggregate of possible calculated columns as the difference between the amount of revenue and the cost. Once the data is prepared, the Map, Chart and Matrix visuals in Power BI are employed for developing the interactive report and dashboard (Sarker, 2021). It used for organizational exploration and analysis of important values for instance, changes in revenues, customers’ classification and even product outputs. A few have features like slicers and drill through options that permit the user to analyze the data dynamically. The VertiPaq engine provides great value in delivering fast queries and data compression which is quite useful in such structure proffered by the given data set. However, such integration with external data sources helps the infrastructure to stay fit for processing big data scenarios. The dashboards of the Power BI are easy to use and very effective for the drawing of the insights even by the users with low technical experience (Green, 2021). Altogether, the data storage and analysis design is effective and efficient, thus the structure can satisfy the organizational requirement of analytical now and future. The build of the demonstrable artefact focuses on the incorporation of a given dataset into Power BI to form an efficient and informative analytics dashboard. This tool is meant for processing structured data, creating meaningful visualizations and demonstrating how it works in a real world scenario.
Part 2 - the Development of a Demonstrable Artefact
The artefact was created with the help of the data set uploaded in the Excel format to become the source of structured transactional data. The development process started by urgently loading the dataset into Power BI because of its integration feature. This was done by data transformation and then modeling, before the development of live interactive dashboards for the delivery of the results.
Outline of the Development of the Artefact
The process of getting the data into the Power BI tool began with the use of Power BI’s Power Query Editor to import the dataset. In this phase, basic data quality operations were also conducted engaging into the missing value handling, the removal of the duplicate data and the normalization of the data fields. Metric-driven columns and measures were defined to obtain transformational metrics like “Total Sales” and “Profit Margin.” The subsequent process was the creation of creating a star schema within the Power BI data model. This structure included a fact table for online transactional data for which the dimensions were, customers, products, and time (Aroraa et al.2022). This organization enhanced my aim of improving the rate of queries and also helped to ease the generation of the visualization. It was then integrated with these datasets to construct this artefact through the use of Power BI’s report and dashboard friendly user interface of Drag ‘n’ Drop visuals.
Development and Structure of the Analytics Dataset
The organization of the analytics dataset followed the same structure of key characteristics of the transactional data. A fact table includes All basic transactional characteristics including the transaction ID, customer ID, product ID, units sold, price per unit and transaction date. Other dimensions involved were the customer with attributes like ID, name and location, product with ID, name, and categories and date with date, month, quarter, and year among others (Wright and Ma, 2022). This star schema model helped to get the best possible performance for analytics. The data set was theoretically obtained through loading data extracted from the Excel file into Power BI data model with further possibility of external data connection through Power Query. Since the data is in Excel format, data cleaning and preprocessing was done in Power Query Editor (Mishra, 2021). Any duality was used and eliminated through the “Remove Duplicates” option, whereas logical missing values were imputed, for example, where the transaction amount was missing, it was replaced by the mean transaction amount.
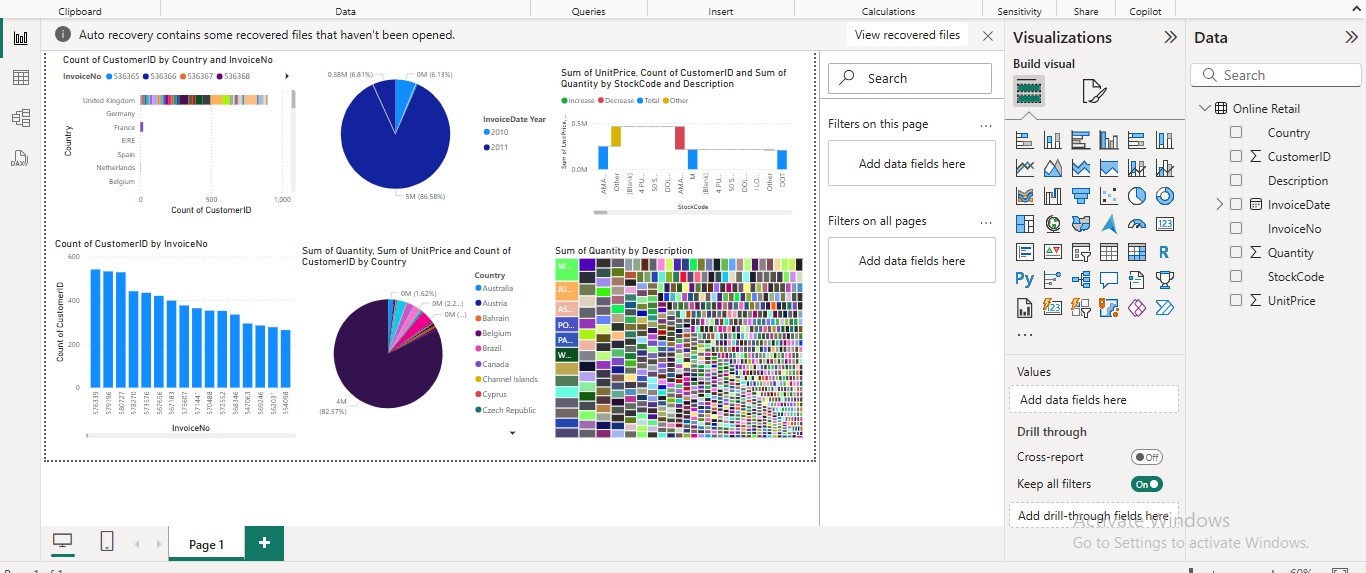
Figure 1: Dashboard
The artefact developed was a Power BI data model screenshot that illustrated the table connections, together with a BI dashboard with bar charts (Sale by Product Category), line charts (Revenue Trend), and Pie chart (Customer Distribution). Through Performance Analyzer in Power BI, the visual interactivity of the analytics solution and its load time were tested for effectiveness for the user.
Evaluation of the Artefact
The artefact effectively proves the utility of the built infrastructure and showcases Power BI as the visualization and analysis medium. It also shows that the previously mentioned transactional data can be effectively utilized in the form of useful information. The artefact also has several advantages which includes; simplest and scalable. Ingesting, transforming and reporting on the data was well facilitated by Power BI through the dataset. This meant that it was possible to develop interactive dashboards which could range from user interfaces that are relatively complex to those that could be easily operated by an average user. Further, the mastery of a star schema and its ability to efficiently store data made it easier to have a perfect model of the data for modelling or making queries without compromising efficiency through analytics (Maier-Hein et al.2022). Nevertheless, the present study identified some areas that could be optimized. The artefact’s focus on a single structured dataset is its biggest drawback. Its further analytical depth would be provided by the inclusion of unstructured or semi-structured data, for example, customer reviews or web logs. The next versions of the artefact can help this by exploring Power BI data flow where different data types and structures are used. Some of the areas that needed to be optimized were shown by performance testing (Carroll et al.2023). For instance, several calculated measures were associated with substantial processing time, which was addressed by pre-aggregating data during the transformation step. Additional viable enhancements can consist of reducing complicated computations, which applies to several data models, or using Direct Query mode in Power BI for obtaining live connections. Lastly, the artefact is useful in illustrating how the developed infrastructure can be of assistance as it presents Power BI as an analytical and visualization tool (D'ignazio and Klein, 2023). As for the further improvement, the analyzed artefact still can act as the suitable ground for the development of the efficient and large scale solutions.
Part 3 -The Testing of a Hypothesis
Hypothesis for Regional Analysis
- Null Hypothesis (H₀): There is no significant difference in purchasing behavior across different regions.
- Research Hypothesis (H₁): There is a significant difference in purchasing behavior across different regions.
- Hypothesis for Product Category Analysis:
- Null Hypothesis (H₀): There is no significant difference in purchasing behavior across different product categories.
- Research Hypothesis (H₁): There is a significant difference in purchasing behavior across different product categories.
Testing
The appliance relates to the overall trend of purchasing behaviour in the various locations in terms of a wide range of visuals in the Power BI report. Therefore the idea is to consider the purchase quantity, the details of the buyer and their transactions. These aspects were analyzed using several forms of the visualizations, specifically bar graphs, waterfall graphs, treemaps and visualizations of both pie and donut charts. These visualizations assisted in analyzing the distinct purchasing behaviour across the regions and products categories including the recent customer activity, frequency of buying, and their inclination towards products.
Bar Chart
The bar chart was useful in easily identifying the number of customers linked to corresponding invoice numbers in various regions. This visualization brought out the difference of customer engagement, some customers having higher counts and more frequent transactions in some countries (Winkle et al.2023). For instance, on the bar chart there was how the invoice was divided among the customers with some regions recurring up to the top of the chart. This pattern implied more stored up purchases in certain regions than in others, which supports the alternative hypothesis.
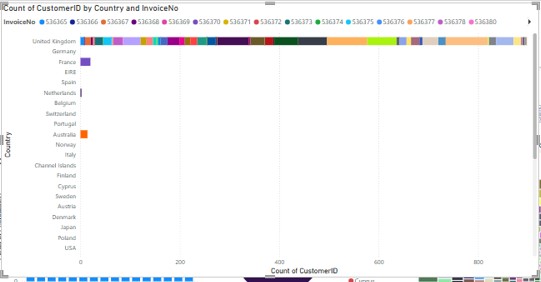
Figure 2: Bar Chart
Waterfall Chart
The waterfall chart made it clear on the sum unit price by the stock code and also indicated the fluctuation of the extent in the total unit price contributions for the products. It was also easy to observe patterns and shifts in the relative contributions of revenues when comparing the chart to other sources of information (Buijsse et al.2023). The steps in the chart were separable differently to illustrate how various product stock codes provided the proportional revenue and this aspect could provide regional or product kind-of pattern.
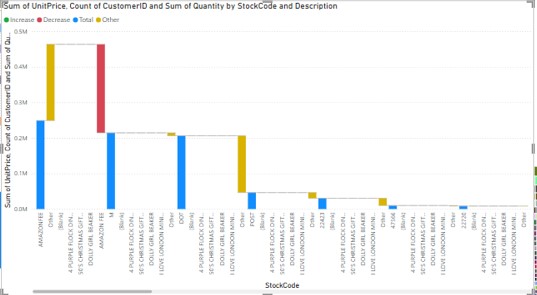
Figure 3: Waterfall Chart
Tree Map
Concerning the quantities sold by product descriptions by regions, the tree map represented this parameter. Hence, this visualization enabled shopping pattern analysis to the extent in which all the products contributed to the overall acquisition quantum. The tree map’s hierarchical organization allowed comparing popular and less popular products and categories within a short amount of time (Efron and Hastie, 2021). For instance, the blocks in the tree map where bigger signified higher quantities of a product purchased, which was linked to particular countries or customers.
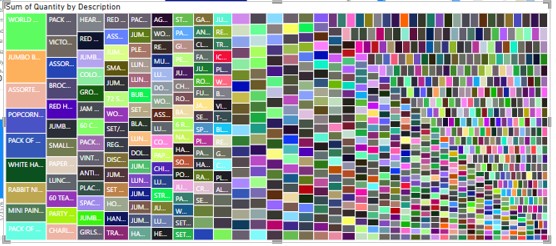
Figure 4: Tree Map
Pie Chart
Pie chart was employed to present the percentage of the transactions or quantities by country which give the overall picture of the buying pattern across regions. In the light of this, the chart undisputedly pointed out that one region accounted for more than 80% of the total quantity bought (Cole et al.2021). This gap also strengthened the alternative hypothesis which holds that purchasing behavior differs from one country to another.
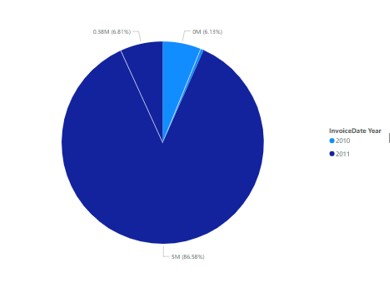
Figure 5: Pie Chart
Donut Chart
Like the pie chart, there was an extra element which is the donut chart of the percentage view of the transaction quantities by year. With such a visualization, it was easier to infer how the buying behavior changed with time and the annual geospatial concentration of sales. Situation with several total figures or transactions the option of having an open center of the donut chart provided more space to label total transactions or quantities to make the visual easier to decipher.
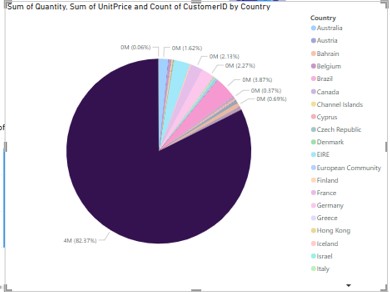
Figure 6: Donut Chart
Part 4 -Legal and Ethical Discussion
Legal Considerations
The artefact that was designed for the purpose of interpreting the purchasing behavior needs to meet certain legal necessities including data, privacy, protection, and intellectual property laws. Legal frameworks like the GDPR or CCPA have arisen because the protection and processing of personal data concern users. While analyzing the artefact the original sources of information include transactional data like the customer ID and purchases have to be masked to protect the identity of individuals. Customers need to know why and how their data is being used, and remain the owners of their data plus should be allowed to withdraw their data . Legal repercussions can be grounded from data breaches. There are necessary security features like, encryption, storing, and the kind of access that must be put in place to avoid cases of infiltration (Top et al.2022). Moreover, legal regulations of intellectual property state that any artefact, which entirely or partially incorporates templates or other external data sets as the part of its creation, must have a proper license of these resources and all used sources of information must be mentioned. Legal compliance is taken to a level that involves endeavoring to get data in a proper and legal way and as permitted by the owners. Non-compliance with such laws attracts penalties, reputational losses and the worst, loss of stakeholder trust. In case the type of business belongs to the healthcare industry or finance and other related areas, some extra rules may be needed. For instance, while managing healthcare data it is mandatory to take into consideration HIPAA and while managing financial data it is mandatory to take into consideration SOX rules. If used in such a context, the artefact must meet these specific characteristics. With advancement in the functionalities, embraced by the artefact, legal audits will be essential in offering compliance repeatedly.
Ethical Considerations
Ethical issues are concerned with the rights and wrongs of constructing and deploying the artefact. The maneuver has to not bring in libelous biases in the case that they’ll cause predetermined unethical judgment. Typically, the dataset can learn some regions or customers; in such a case, the knowledge produced can prove beneficial to specific business stakeholders while presenting some disadvantage to others. It is also known that due to presenting quantitative and qualitative data, it’s necessary to be transparent with the methodology and limitations to make the audience aware of details. The oversight in presentation of data could also lead to wrong conclusions and therefore wrong decisions are made. The three other foundational ethical issues include: The consequences of decision made by the artefact. To clean out the excess of the advantages of customer data, the collected insights should be applied to enhance the service to benefit from the customers’ information rather than use it. There should not be a cost borne to the vulnerable part of the society or there should not be a rent shift for the benefits of some parties. On the other hand, when adopting machine learning to the artefact, the following ethical issues arise paradigmatic to this configuration: Due to the non-deterministic and somewhat greedy nature of the elements of a machine learning model, one can explain why a particular result is obtained. It can give substandard performance or substandard predictions that are disagreeable to the shareholders of the firm and other stakeholders. Moreover, there is a need to schedule additional checks on more elaborative machine learning models, and also pretensions of the role of consequences. Second, the pursuance of the principle of informed consent as a standard also holds true. The majority of customers have to provide their data to the company; companies have to employ their customer’s data for machine learning; customers must also have the right to opt-out for the process. These values also comprise of the ways through which the insights formed in the artefact is applied within the organization environment. For instance, when the artefact mainly focuses on the purchase behavior, revealing the propensity of one segment of customers towards a particular product or service then the information has to be well managed. It should not be hard for contestants to practice some such things as undercutting, or engaging in predatory price or discrimination of their products.
Future Considerations with Machine Learning
That the intervention of machine learning can be introduced within the artefact props up other legal and ethical issues. It can therefore be said with certainty that, by applying machine learning into the artifact, those suggestions can be enhanced with trends, customer preferences and even ideas that could have been automated. However, these advantages should not be achieved at the price constraining neglecting such problems of over training the data set, lack of interpretability of the decision making, and misuse of the results of the predictions. For example, an uneven data set can be employed to create a machine learning model with higher benefits for particular kinds of customers while denying the others. This is true since accountability becomes a major concern when dealing with machine learning. It must also be clear where the primary source of a problem is when an undesired outcome has been created through the artifact's self-decision – the developer whose tool this is, the user who engaged the tool, or the organization that has deployed the tool. To avoid this the testing and validation of machine learning models for fairness alongside with the model’s development, and implementation must be done rigorously. Some of which are retained in the fundamental aspects of AI Ethics such as explain ability and fairness should be the foundation on which features of machine learning are initiated and deployed. The organization also has to ensure that the customers are aware of and are in consent with their data to be part of an estimate model. Another area where machine learning extends challenges is data security. Since customer data is also used for training models in today’s applications, their storage and processing should be secure. The legal consequences that may ensue from the breach or misuse of such data are serious but perhaps every bit as critical are the reputational risks.
Conclusion
The artefact that has to be developed should work within certain legal and ethical framings as to avoid misuse. Legal factors not only involve data protection and privacy laws, proprietary rights, and rules mostly related to the industry it operates in. Ethical considerations encompasses; relevance, resonance, accountability, and no-harm rules to the stakeholders. If machine learning is added in the future, there are further issues that the artefact has to tackle, such as algorithmic bias, who is responsible for it and how to get informed consent. Subject to these principles, the artefact is capable of creating value by ensuring that the interest of all the stakeholders is protected.
Reference List
- Aroraa, G., Lele, C. and Jindal, M., 2022. Data Analytics: Principles, Tools, and Practices: A Complete Guide for Advanced Data Analytics Using the Latest Trends, Tools, and Technologies (English Edition). BPB Publications.
- Belle, V. and Papantonis, I., 2021. Principles and practice of explainable machine learning. Frontiers in big Data, 4, p.688969.
- Buijsse, R., Willemsen, M. and Snijders, C., 2023. Data-Driven Decision-Making. In Data Science for Entrepreneurship: Principles and Methods for Data Engineering, Analytics, Entrepreneurship, and the Society (pp. 239-277). Cham: Springer International Publishing.
- Cady, F., 2024. The data science handbook. John Wiley & Sons.
- Carroll, S.R., Garba, I., Figueroa-Rodríguez, O.L., Holbrook, J., Lovett, R., Materechera, S., Parsons, M., Raseroka, K., Rodriguez-Lonebear, D., Rowe, R. and Sara, R., 2023. The CARE principles for indigenous data governance. Open Scholarship Press Curated Volumes: Policy.
- Cole, C.L., Sengupta, S., Rossetti, S., Vawdrey, D.K., Halaas, M., Maddox, T.M., Gordon, G., Dave, T., Payne, P.R., Williams, A.E. and Estrin, D., 2021. Ten principles for data sharing and commercialization. Journal of the American Medical Informatics Association, 28(3), pp.646-649.
- D'ignazio, C. and Klein, L.F., 2023. Data feminism. MIT press.
- Divakaran, S., 2022. Data Science: Principles and Concepts in Modeling Decision Trees. Data Science in Agriculture and Natural Resource Management, pp.55-74.
- Efron, B. and Hastie, T., 2021. Computer age statistical inference, student edition: algorithms, evidence, and data science (Vol. 6). Cambridge University Press.
- Green, B., 2021. Data science as political action: Grounding data science in a politics of justice. Journal of Social Computing, 2(3), pp.249-265.
- Maier-Hein, L., Eisenmann, M., Sarikaya, D., März, K., Collins, T., Malpani, A., Fallert, J., Feussner, H., Giannarou, S., Mascagni, P. and Nakawala, H., 2022. Surgical data science–from concepts toward clinical translation. Medical image analysis, 76, p.102306.
- Mishra, S., 2021. Emerging Technologies—Principles and Applications in Precision Agriculture. Data science in agriculture and natural resource management, pp.31-53.
- Sarker, I.H., 2021. Data science and analytics: an overview from data-driven smart computing, decision-making and applications perspective. SN Computer Science, 2(5), p.377.
- Top, J., Janssen, S., Boogaard, H., Knapen, R. and Şimşek-Şenel, G., 2022. Cultivating FAIR principles for agri-food data. Computers and Electronics in Agriculture, 196, p.106909.
- Wickham, H., Çetinkaya-Rundel, M. and Grolemund, G., 2023. R for data science. " O'Reilly Media, Inc.".
- Winkle, K., McMillan, D., Arnelid, M., Harrison, K., Balaam, M., Johnson, E. and Leite, I., 2023, March. Feminist human-robot interaction: Disentangling power, principles and practice for better, more ethical HRI. In Proceedings of the 2023 ACM/IEEE International Conference on Human-Robot Interaction (pp. 72-82).
- Wright, J. and Ma, Y., 2022. High-dimensional data analysis with low-dimensional models: Principles, computation, and applications. Cambridge University Press.
- Yu, B. and Singh, C., 2022. Seven principles for rapid-response data science: lessons learned from Covid-19 forecasting. Statistical Science, 37(2), pp.266-269.

