Business Intelligence Using Excel Assignment Example
- 92650+ Project Delivered
- 1500+ Experts 24x7 Online Help
- No AI Generated Content
An Overview Of The Stayway Company Revenues In The Global Economy And Their Business Intelligence Assignment
1.0 Last 15 years sales revenue
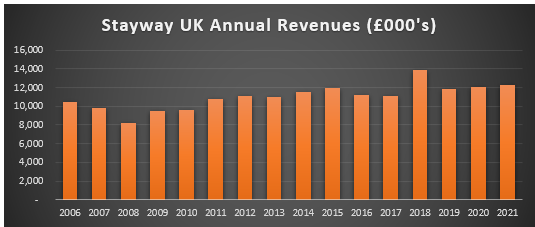
Figure 1: “Annual Revenues of the Stayway clothing industry in UK”
(Source: Self-made in MS-Excel)
This is the bar graph of annual revenues of a clothing industry named Stayway which is situated inside the country Uk. The company not only manufactures their products inside the country but also in the outside they manufacture their products. This graph only represents the annual revenues of Stayway in UK. In the x axis is it can be seen the years and in the y axis it can be seen the revenues of the company yearly basis (Ain et al. 2019). This is the incomes of last 15 years of the Stayway company. From the graph it is seen that in every year their revenues are almost average. In the year of 2018 the gained profit the most and in the year of 2008 their revenue is less than other years.
Get free written samples by our Top-Notch subject experts and Assignment Help UK team.
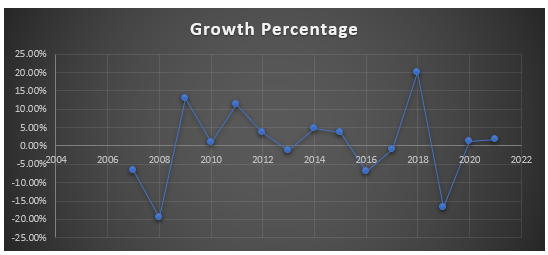
Figure 2: “Yearly basis Growth percentage of the Stayway company (2006 to 2021)”
(Source: Self-made in MS-Excel)
This above illustration represents the growth percentage of the Stayway company in the UK. From the figure it is clear that in the 2018 their growth percentage is maximum and, in the year of 2008, there growth percentage is minimum (Bordeleau et al. 2018). Normally the growth of the Stayway company is going well but in the year 2016 and 2019 their growth certainly falls down compare to the normal growth of others year. But again, they quite improved in the next years which is a very good sign for the company and their business.
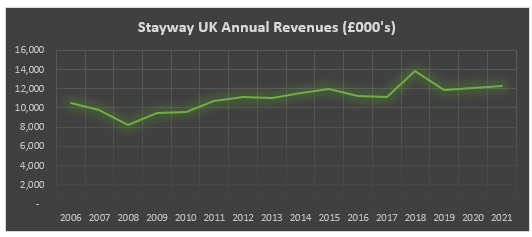
Figure 3: “Yearly Incomes of the Stayway clothing industry in UK”
(Source: Self-made in MS-Excel)
This is a line graph showing the annual revenues of Stayway, an apparel company based in the United Kingdom. The corporation not only makes things within the nation, and also multinational firm beyond the nation (Božič and Dimovski, 2019). This graph exclusively depicts Stayway's total profits with in United Kingdom. The years could be viewed on the x axis, while the profits of the firm could be seen on the y axis. This is a summary of the Stayway company's earnings over the last 15 years. According to the chart, their sales are around normal in each year. In 2018, they made the maximum profit, and in 2008, their income was lower than the number years.
“Summary statistics of the Stayway company regarding their yearly revenue”
(Source: Self-made in MS-Excel)
The above figure represents the summary statistics of annual revenue of the Stayaway company in UK. The statistics is calculated based on the Stayway company revenue of last 15 years. This is also known as descriptive statistics. In these statistics it can see different values of mean, median as well as mode etc. The value of mean of the annual revenue is approx. 11056.66667. The value of standard error is approx. 356 (Caseiro and Coelho, 2019). The value of the median is 11145. The standard deviation value of the annual revenue is approx. 1382. The minimum value of the revenue is 8221 and the maximum value of the revenue is 13887. The summation value is approx. 165850. The value of the count is 15. In addition to this the value of the sample variance skewness can be also known from the descriptive statistics.
Descriptive statistics give concise descriptions of the samples as well as the findings which were collected. Such highlights can be numerical, in other words "summary statistics", or graphical, i.e., "simple graphics" (Cheng et al. 2020). Such descriptions might serve as the foundation for a preliminary presentation of data as component of a bigger data methods, or they could be adequate in & of itself for specific research. Statistics is involved with the empirical process of gathering, organizing, analyzing, as well as interpreting data for the purposes of descriptions as well as decision making.
2.0 Economic indicator data analysis
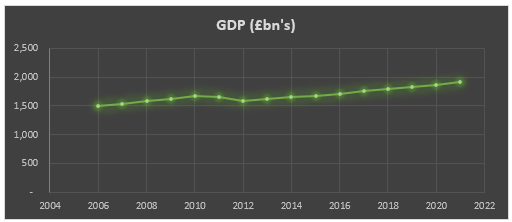
Figure 5: “Annual GDP rating of the Stayway Company as an economic indicator”
(Source: Self-made in MS-Excel)
This is the line graph of annual GDP rating of the Stayway company. This is one of the economic indicators. The x-axis of the graph represents the year and the y axis represents the annual GDP rating (Choi et al. 2020). From the graph it is clear that the GDP rating of the Stayway company is continuously increasing except the year 2012. Only in the year of 2012 the GDP value of Stayway company is slightly decreased.
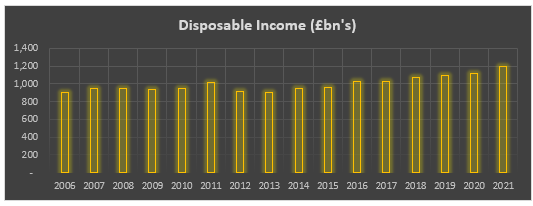
Figure 6: “Annual Disposable Income rating of the Stayway Company as an economic indicator”
(Source: Self-made in MS-Excel)
Here in the graph the disposal income is represented as the economic indicator. The x-axis of the graph represents the year and the y axis represents the annual “Disposal income” rating. From the figure it is seen that the maximum disposable income comes in the year 2021 (Jaklič et al. 2018). In addition to this the minimum disposable income is found in the year of 2013.
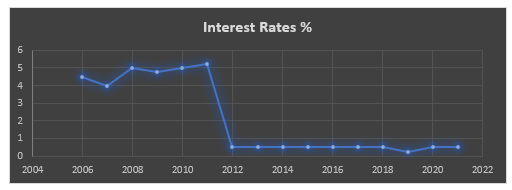
Figure 7: “Annual Interest rating of the Stayway Company as an economic indicator”
(Source: Self-made in MS-Excel)
Here in the graph the interest rate is represented as the economic indicator. The x-axis of the graph represents the year and the y axis represents the annual “interest rate” rating. From the figure it is seen that the maximum interest rate comes in the year 2011 (Jalil and Hwang, 2019). In addition to this the minimum interest rate is found in the year of 2019.
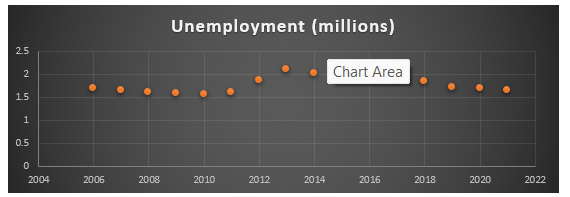
Figure 8: “Annual unemployment rating of the Stayway Company as an economic indicator”
(Source: Self-made in MS-Excel)
The above graphical illustration shows the unemployment rating of the Stayway Company. By this scatterplot diagram it can be easily compare the rating of unemployment of those 15 years. The x-axis of the graph represents the year and the y axis represents the annual “unemployment” rating (Jalil et al. 2019). From the figure it is seen that the maximum unemployment quantity can be observed in the year 2013. In addition to this the minimum unemployment rate is found in the year of 2010.
The difficulties intrinsic inside the current fast fashion industry, as well as rising sense of its adverse environmental implications, have fueled the growth of the ‘slow style' trend, that preserves materials as well as decrease the incidence at that it uses. Slow development is fueled via 'ethical consumption,' that has increased customer demands for even more ecological items, as well as prioritizes excellence, with a limit of 4 seasons a year as a greater sustainable option (Liang and Liu, 2018). Such conflicting position is examined in this paper, that includes perspectives across major players (garment stores, labels, as well as producers) regarding garment lifespan, which would be a part of the slow fashion sector.
3.0 Analysis of UK sales by regions and stores
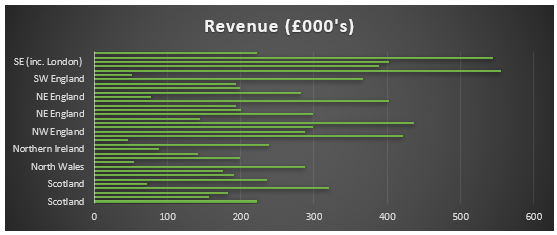
Figure 9: “Annual Revenue rating of the Stayway Company in different contries”
(Source: Self-made in MS-Excel)
This is the bar graph of annual revenue of Stayway company in different countries. The x-axis of this graph represents the annual revenue and the y-axis of this graph represents the country name (Mariani et al. 2018). From the graph it is seen that the annual revenue in the country London is maximum. On the other hand, the annual revenue in the country of Northern Ireland is minimum. Except this, the annual revenue of the company in other countries can also be seen in the bar graph. By observing this graph anyone can easily understand the annual revenues of those countries.
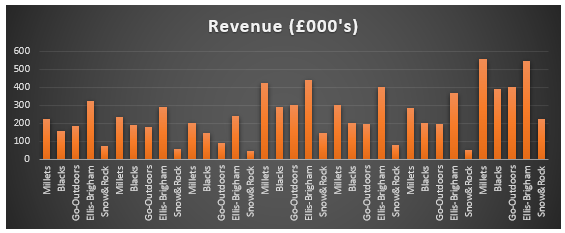
Figure 10: “Annual Revenue rating of the Stayway Company in different stores”
(Source: Self-made in MS-Excel)
This is a bar graph depicting the annual income of the Stayway corporation in various outlets throughout the world. The x-axis of this graph reflects the store's name, while the y-axis represents the company's yearly sales (Puklavec et al. 2018). The graph shows that the yearly income at the shop Millet is the highest. Snow & Rock's annual income, on the other hand, is negligible. Aside from that, the bar graph shows the annual income of the other stores. Anyone may readily grasp the annual revenues of those stores by looking at this graph.
4.0 Analysis of Stayway product sales
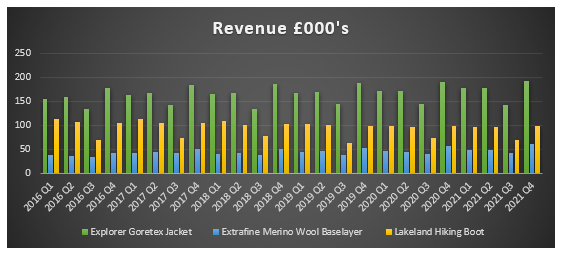
Figure 11: “Annual Revenue rating of key products of the Stayway Company inside the UK”
(Source: Self-made in MS-Excel)
This is the bar graph as per the annual revenue of various products of the Stayway company. Here it can be seen mainly three types of products which are manufactured by the company. By analyzing the graphical illustration, it can be easily compared between those three products. The x-axis of this graph represents the year as well as the y-axis of this graph represents the annual revenue of the company (Rahardja and Harahap, 2019). In this graph the green line indicates the jacket sales by the company, The blue line indicates the wool base layer as well as the yellow line indicates the hiking boots sales. From the figure it is seen that the demand of the jacket is very high as well as the demand of the hiking boot is extremely low. The demand of the wool base layer is average (Torres et al. 2018). First comes to the jacket sales, In the last year that means in the fourth quarter of 2021 the company is sold the highest number of jackets and in the third quarter of 2016 they sold minimum number of jackets. Similarly with the jacket sales the company makes their highest profit from the base layer wool in the fourth quarter of 2021 (Rikhardsson and Yigitbasioglu, 2018). The company has faced with the huge loss regarding their wool base layer in the second quarter of 2016. Finally, when it comes to the hacking boot, it is seen that the company makes their highest profit when they introduce this hiking boot and day by day their revenues is decreasing. In the third quarter of 2016 and 2021 they faced with huge loss.
5.0 Jacket price analysis
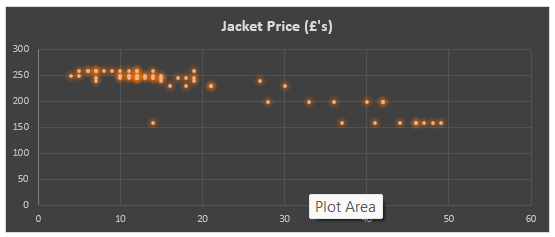
Figure 12: “Scatterplot of jacket price provided by the retailer Ellis-Brigham”
(Source: Self-made in MS-Excel)
The above graphical illustration represents the scatterplot which is created depending on the jacket price produced by the Stayway company. These jackets are provided by the retailer named Ellis-Brigham. This "scatter plot" is a popular diagnostic technique for determining temporal trends inside the prevalence of behavioral issues. Moreover, the degree to which those trends are regularly recognized is uncertain because little study has been conducted in the direction of evaluating this scatter plot's normal value. The findings are examined in terms of the feasibility of performing statistical models using scatter plot information as well as of gathering information for the amount of time required for demonstrating the statistical importance (Torres et al. 2018). This is found that extensive functional or qualitative studies which revealed cause-effect or causal linkages among behavior as well as local ecological occurrences might be more accurate along with efficient types of evaluation. Identifying the dividing line among clothing along with fashion is difficult because they largely arise by the side of a spectrum among structural as well as cosmetic priorities; it has thus selected to correspond towards the apparel industry throughout this context because this is quite properly delineated as well as also has a wider level environmental effect because this includes only those clothing kinds. Prior scientific work in to the continuously evolving longevity inside the portion of supply chain system is severely limited, despite the fact that government-funded articles had also discussed the subject as well as a need for greater in-depth studies within apparel durability, along with behavior related to clothing servicing along with removal, has been recognized. This is a significant issue in the direction of examining since "life cycle assessment" (LCA) has discovered how prolonging the exciting life of apparel through development, repair, as well as re-use of clothes has been the major excellent approach of minimizing the environmental effect of the fashion industry.
6.0 Store performance analysis
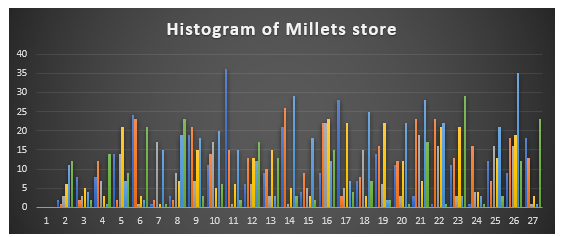
Figure 13: “Histogram plot of waiting times of Millet stores of Stayway Company”
(Source: Self-made in MS-Excel)
This is the Histogram plot which is made based on the waiting times outside the Millet stores of the company for purchasing any kind of product. This histogram plot gives an overall concept of the waiting time of the particular store. From the graph it is observed that the waiting time is not same all the time. Sometime it takes very long moment of instance and sometime it does not take lengthy time. One of most popular charts for displaying "frequency distribution" tables is a histogram. This appears almost similar to a bar chart, however there are significant distinctions among them. This is one of the useful information gathering as well as analysis technique. This also has some fundamental qualities.
Histograms are charts which show how the continuous information is distributed. It is excellent exploration instruments since it discloses aspects regarding the data collected. Whereas the mean as well as the standard deviation might provide a numerical summary of any information, histograms come all sampling information to life (Torres et al. 2018). While it has real time monitoring & would like to estimate the properties of results as well as seek for anomalies, utilize histograms. Such charts divide the real time monitoring within frequency categories called as bins. Every bin is shown by a bar which reflects the proportion of data which belong into that bin. Histograms are visual representations of leaf & stem plots.
7.0 Conclusion
Commodity lifespan has been the social as well as environmental considerations which might help to reduce "ecological management" implications. Decisions made during "product development" operations may have a significant impact on the spectrum of items that are enduring. Garment appears to be the most profitable manufacturing business inside the United Kingdom, and as such, it already has a tremendous impact by the side of both populace as well as the environment. Longevity is however a major problem for the fashion industry, since the production and distribution phases of the "garments product lifecycle" have significant environmental consequences as the price of things purchased has grown. "Post-purchase" apparel issue is also harmful towards the environment, as well as the product evolution might impact apparel sustainability objectives via management as well as disposal.
Design is a significant element of the clothing business, since Stayway is one of the top clothing companies inside the UK via sales offer mostly fashion-oriented lines. Fashion industry, that is, clothes in modern designs that are developed as well as manufactured inside a comparatively short timeframe, plainly feeds upon regularly shifting trends as well as resulting depreciation, and therefore appears to be inconsistent with the concept of retaining clothing for a lengthy moment of time (Torres et al. 2018). As a consequence of the inappropriate use as well as destruction of precious natural sources, fashion industry generates a reasonably high share of sustainability issues inside the entire apparel business, like fabric waste management. This research highlights the possibly opposing conflicts which might arise among sustainable practices as well as commerciality, highlighting the problem of authority, or the lacking thereof, in resolving as well as growing such creative as well as economic dilemma.
8.0 Reference List
Journals
Ain, N., Vaia, G., DeLone, W.H. and Waheed, M., 2019. Two decades of research on business intelligence system adoption, utilization and success–A systematic literature review. Decision Support Systems, 125, p.113113.
Bordeleau, F.E., Mosconi, E. and Santa-Eulalia, L.A., 2018, January. Business Intelligence in Industry 4.0: State of the art and research opportunities. In Proceedings of the 51st Hawaii International Conference on System Sciences.
Božič, K. and Dimovski, V., 2019. Business intelligence and analytics for value creation: The role of absorptive capacity. International journal of information management, 46, pp.93-103.
Caseiro, N. and Coelho, A., 2019. The influence of Business Intelligence capacity, network learning and innovativeness on startups performance. Journal of Innovation & Knowledge, 4(3), pp.139-145.
Cheng, C., Zhong, H. and Cao, L., 2020. Facilitating speed of internationalization: The roles of business intelligence and organizational agility. Journal of Business Research, 110, pp.95-103.
Choi, J., Yoon, J., Chung, J., Coh, B.Y. and Lee, J.M., 2020. Social media analytics and business intelligence research: A systematic review. Information Processing & Management, 57(6), p.102279.
Jaklič, J., Grublješič, T. and Popovič, A., 2018. The role of compatibility in predicting business intelligence and analytics use intentions. International Journal of Information Management, 43, pp.305-318.
Jalil, N.A. and Hwang, H.J., 2019. Technological-centric business intelligence: Critical success factors. Int. J. Innov. Creat. Chang.
Jalil, N.A., Prapinit, P., Melan, M. and Mustaffa, A.B., 2019, November. Adoption of business intelligence-Technological, individual and supply chain efficiency. In 2019 International Conference on Machine Learning, Big Data and Business Intelligence (MLBDBI) (pp. 67-73). IEEE.
Liang, T.P. and Liu, Y.H., 2018. Research landscape of business intelligence and big data analytics: A bibliometrics study. Expert Systems with Applications, 111, pp.2-10.
Mariani, M., Baggio, R., Fuchs, M. and Höepken, W., 2018. Business intelligence and big data in hospitality and tourism: a systematic literature review. International Journal of Contemporary Hospitality Management.
Puklavec, B., Oliveira, T. and Popovič, A., 2018. Understanding the determinants of business intelligence system adoption stages: An empirical study of SMEs. Industrial Management & Data Systems.
Rahardja, U. and Harahap, E.P., 2019, July. Implementation of Information Planning and Strategies Industrial Technology 4.0 to Improve Business Intelligence Performance on Official Site APTISI. In Journal of Physics: Conference Series (Vol. 1179, No. 1, p. 012111). IOP Publishing.
Rikhardsson, P. and Yigitbasioglu, O., 2018. Business intelligence & analytics in management accounting research: Status and future focus. International Journal of Accounting Information Systems, 29, pp.37-58.
Torres, R., Sidorova, A. and Jones, M.C., 2018. Enabling firm performance through business intelligence and analytics: A dynamic capabilities perspective. Information & Management, 55(7), pp.822-839.

