
Business Analysis And Planning Assignment Sample
There are lot of scope in residential care homes business as there are high growth prospects but providing good quality of service to customers is inevitable to earn good quality of profit in the business.
- 92650+ Project Delivered
- 1500+ Experts 24x7 Online Help
- No AI Generated Content


Introduction Of Business Analysis And Planning
Data analytics is one of the fastest-growing fields in the world. In this report, the data collection strategy is discussed in detail alongside a comprehensive range of data analysis techniques. The middle section incorporates thematic analysis as well as regression analysis conducted using SPSS, culminating in a structured conclusion that ties the entire research work together. For students navigating quantitative statistical tools like SPSS and qualitative research frameworks, platforms like New Assignment Help UK offer reliable academic guidance on structuring data-driven reports effectively
Data collection strategy in respect to primary and secondary sources
Data collection strategy refers to the tactics that are followed to gather data from multiple sources. There are two sources from which data is usually gathered, namely primary and secondary data. In respect to primary sources, three strategies are commonly followed, like surveys, special interviews and focus groups. In special interview detail, discussion is carried out in respect to the research topic with specific persons (Chan, Fung and Chien, 2013). Whereas, in the focus group, there are multiple people that carried out research on specific topics. In the present research study, data will be collected through primary sources, and in this regard, a questionnaire will be distributed among respondents. A sample of 30 people will be taken, and from them, opinions on varied questions will be collected. Apart from this, secondary data will be collected from books, journals and magazines (Karkala and Yalavarthy, 2012). In order to conduct secondary research, varied websites and journals will be reviewed. This is the entire plan that will be followed for conducting research.
Secondary data analysis
According Gordon et al. (2013), residential care homes are becoming more popular in the UK, as in relevant establishments good care is taken of patients, and proper treatment is given to them, which ensures that they will remain healthy. This is the reason due to which the popularity of the residential care home has grown at a rapid pace in the mentioned nation. The presence of a regulatory body also ensures that people will be treated in residential care homes in a proper manner and they will not face any sort of problem at the workplace.
Contrary to this, Sahota, Morgan and Moran (2012) state that the fee in care homes is very high, and due to this reason, everyone can not afford service in a care home. Many times instead of a high fee, the service delivered is not up to the expected quality. Hence, it can be said that many times the selection of a care home proved to be a wrong decision. In many care homes, a family-like environment is not given, and due to this, people feel an absence of cordial relationships in their lives. Hence, all these things negatively affect individuals' mental conditions. Small living space is one of the factors that have an impact on patients at social care settings. Individuals want to live an independent life and want more space in respect to social relationships. Such kinds of things are many times not observed in social care settings, and such kinds of things
Complex range of techniques to analyse data
- Observation: Under this method, researchers do detailed observation of varied things and, on that basis, find out lots of facts related to the research topic. By doing so, arrive at a specific conclusion. It can be said that observation is the method which is employed for analysis by the researchers.
- Focus group: In this technique, a specific topic is discussed between a panel of experts, and varied facts are identified. On the basis of discussion, a final consensus is obtained on a specific point (How to Conduct a Successful Focus Group Discussion, 2017). This approach is usually used when any burning topic is discussed between experts.
- Contact interview: It is different from the focus group method because in this interview a single person is taken, and detailed discussion like in the focus group is carried out. This means that instead of discussing a topic with multiple people, only one expert is invited for discussion purposes.
- Thematic analysis: In this approach a frequency table is generated, and it is identified how much response is given by respondents in each category. Thus, the specific direction in which respondents give responses can easily be identified by using thematic analysis.
- Regression: It is an advanced technique by which the relationship between dependent and independent variables is identified (Hosmer, Lemeshow and May, 2011). There are multiple statistics in regression which assist in measuring the relationship between both sorts of variables.
|
Do you know about residential care homes? |
|||||
|
Frequency |
Percent |
Valid Percent |
Cumulative Percent |
||
|
Valid |
Yes |
30 |
100.0 |
100.0 |
100.0 |
Interpretation
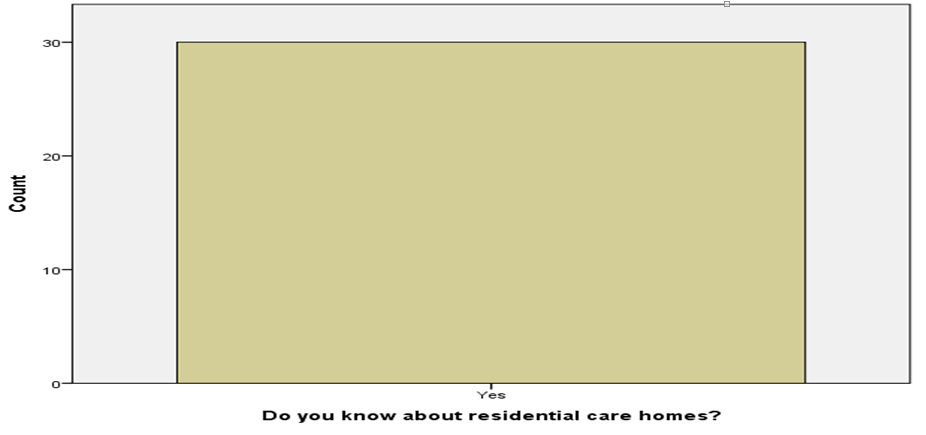
The chart is reflecting that all respondents know about residential care homes. It can be said that residential care homes are gaining wide popularity among people.
|
Family environement in usually available in luxury residential care homes? |
|||||
|
Frequency |
Percent |
Valid Percent |
Cumulative Percent |
||
|
Valid |
Strongly agree |
8 |
26.7 |
26.7 |
26.7 |
|
Agree |
11 |
36.7 |
36.7 |
63.3 |
|
|
Neutral |
5 |
16.7 |
16.7 |
80.0 |
|
|
Disagree |
4 |
13.3 |
13.3 |
93.3 |
|
|
Strongly disagree |
2 |
6.7 |
6.7 |
100.0 |
|
|
Total |
30 |
100.0 |
100.0 |
||
Interpretation
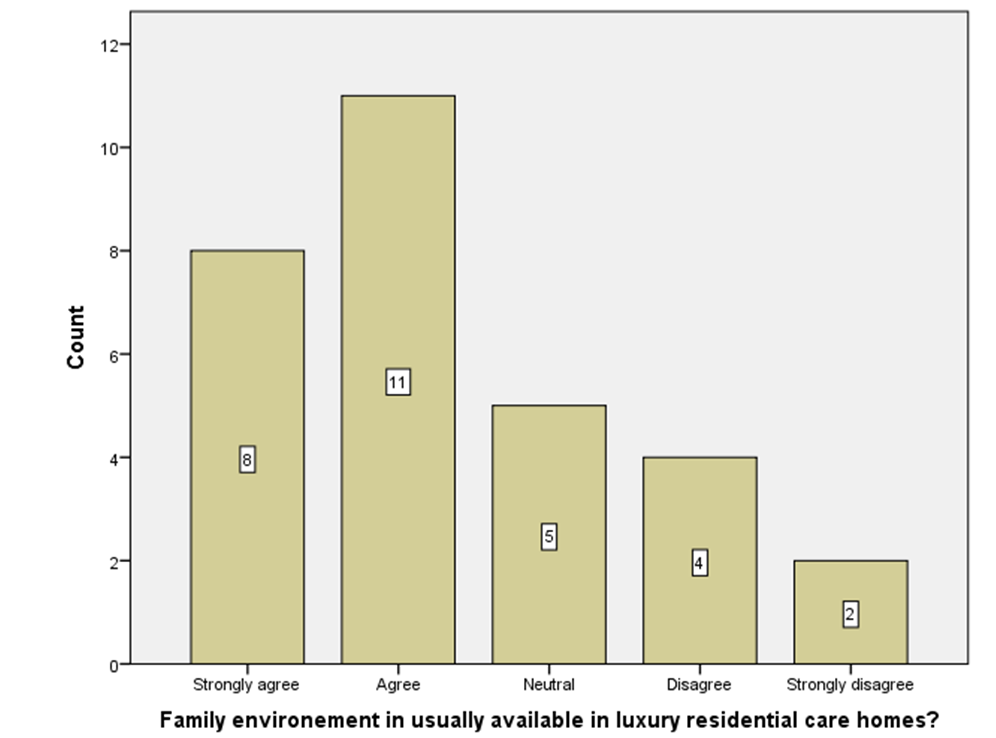
Facts are reflecting that there are 8 respondents that strongly agree and 11 that agree on the same statement. Only 5 are neutral, followed by 4 disagree and 2 strongly disagree. It can be said that the majority of respondents agree with the asked statement.
|
Excellent quality of service support is given by staff members in luxury residential care homes. |
|||||
|
Frequency |
Percent |
Valid Percent |
Cumulative Percent |
||
|
Valid |
Strongly agree |
15 |
50.0 |
50.0 |
50.0 |
|
Agree |
4 |
13.3 |
13.3 |
63.3 |
|
|
Neutral |
3 |
10.0 |
10.0 |
73.3 |
|
|
Disagree |
6 |
20.0 |
20.0 |
93.3 |
|
|
Strongly disagree |
2 |
6.7 |
6.7 |
100.0 |
|
|
Total |
30 |
100.0 |
100.0 |
||
Interpretation
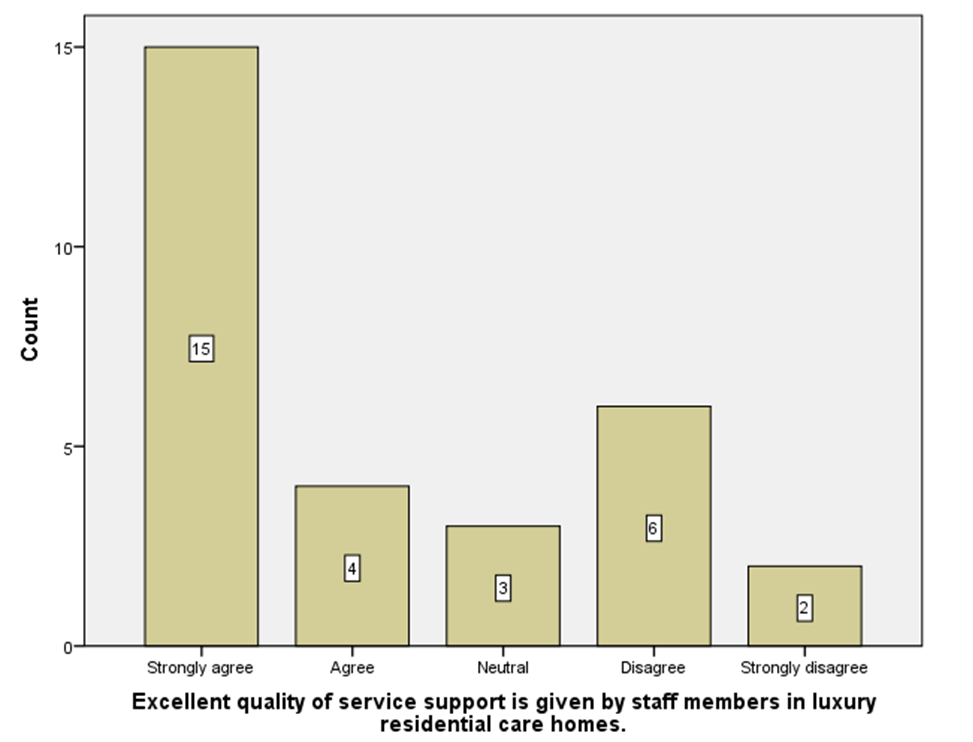
Facts are reflecting that 15 respondents strongly agree and 4 agree, followed by 3 who are neutral on the asked statement. There are 6 respondents that disagree and 2 respondents that strongly disagree with the same statement. It can be said that the majority of respondents have a positive perception about the service quality of residential care homes.
|
Do you agree with the fact that there are many luxury residential care homes that failed to provide services upto expected level. |
|||||
|
Frequency |
Percent |
Valid Percent |
Cumulative Percent |
||
|
Valid |
Strongly agree |
8 |
26.7 |
26.7 |
26.7 |
|
Agree |
2 |
6.7 |
6.7 |
33.3 |
|
|
Neutral |
2 |
6.7 |
6.7 |
40.0 |
|
|
Disagree |
8 |
26.7 |
26.7 |
66.7 |
|
|
Strongly disagree |
10 |
33.3 |
33.3 |
100.0 |
|
|
Total |
30 |
100.0 |
100.0 |
||
Interpretation
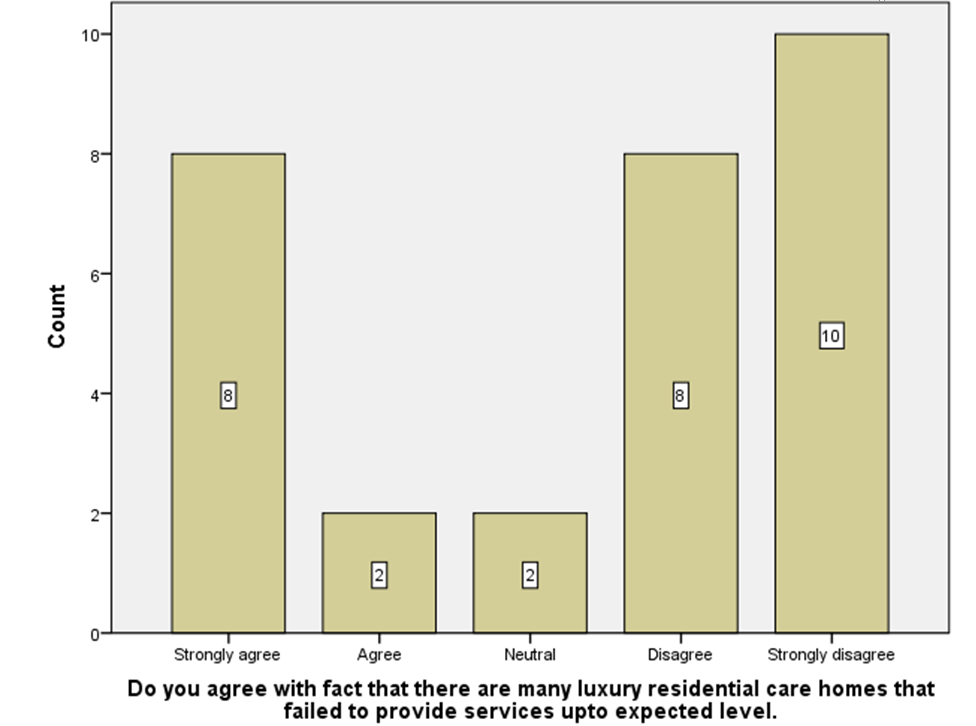
There are 8 respondents that strongly agree and 2 that agree on the same statement. Apart from this, 2 respondents are neutral, and 8 disagree with the same statement. Along with this, 10 respondents come in the strongly disagree category. It can be said that the majority of respondents disagree with the statement that multiple luxury residential care homes failed to provide relevant services to customers.
|
If the service provided by the luxury residential care home is of good quality, not excellent, then also it is recommended by people to each other? |
|||||
|
Frequency |
Percent |
Valid Percent |
Cumulative Percent |
||
|
Valid |
Strongly agree |
9 |
30.0 |
30.0 |
30.0 |
|
Agree |
6 |
20.0 |
20.0 |
50.0 |
|
|
Neutral |
5 |
16.7 |
16.7 |
66.7 |
|
|
Disagree |
8 |
26.7 |
26.7 |
93.3 |
|
|
Strongly disagree |
2 |
6.7 |
6.7 |
100.0 |
|
|
Total |
30 |
100.0 |
100.0 |
||
Interpretation
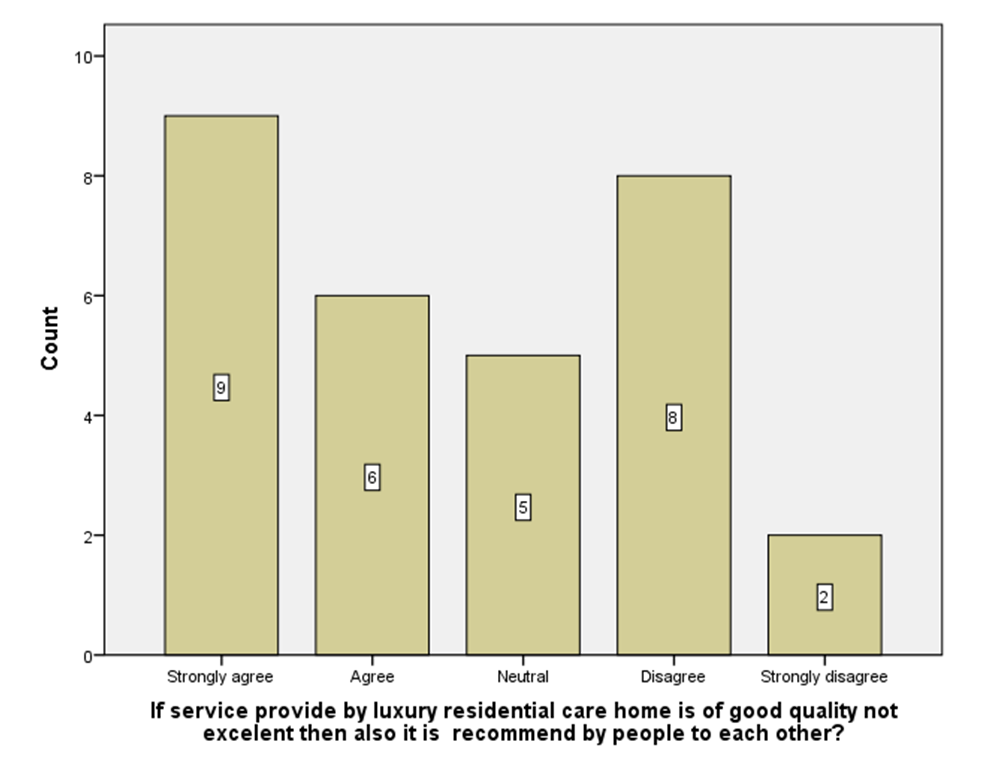
There are 9 respondents who strongly agree and 6 who agree with the fact that if luxury residential care home service quality is good, then also they will recommend its name to other people. 5 are neutral, 8 are disagree, and 2 are strongly disagree with the same fact. It can be said that people give mixed responses to asked questions.
|
Which of the below-given services do you prefer most in luxury residential care homes? |
|||||
|
Frequency |
Percent |
Valid Percent |
Cumulative Percent |
||
|
Valid |
Luxury spa baths |
10 |
33.3 |
33.3 |
33.3 |
|
Activities rooms |
6 |
20.0 |
20.0 |
53.3 |
|
|
Food menu of choice |
2 |
6.7 |
6.7 |
60.0 |
|
|
Room with AC and nice decoration |
12 |
40.0 |
40.0 |
100.0 |
|
|
Total |
30 |
100.0 |
100.0 |
||
Interpretation
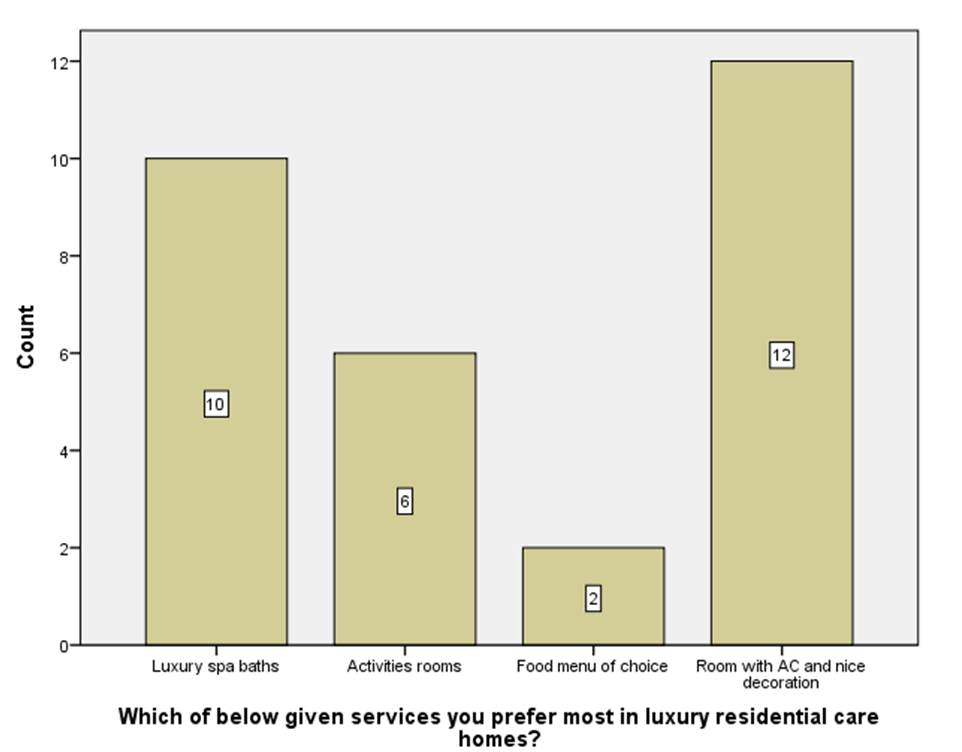
There are 10 observations that like luxury bath services in a relevant sort of residential care home. There are 6 respondents that prefer activity rooms, and 2 like to take the food menu of choice. There are 12 respondents who prefer rooms with AC and nice decoration in residential care homes.
|
In past years the number of people residing in residential care homes has increased at a fast rate. Do you agree? |
|||||
|
Frequency |
Percent |
Valid Percent |
Cumulative Percent |
||
|
Valid |
Strongly agree |
15 |
50.0 |
50.0 |
50.0 |
|
Agree |
6 |
20.0 |
20.0 |
70.0 |
|
|
Neutral |
5 |
16.7 |
16.7 |
86.7 |
|
|
Disagree |
2 |
6.7 |
6.7 |
93.3 |
|
|
Strongly disagree |
2 |
6.7 |
6.7 |
100.0 |
|
|
Total |
30 |
100.0 |
100.0 |
||
Interpretation
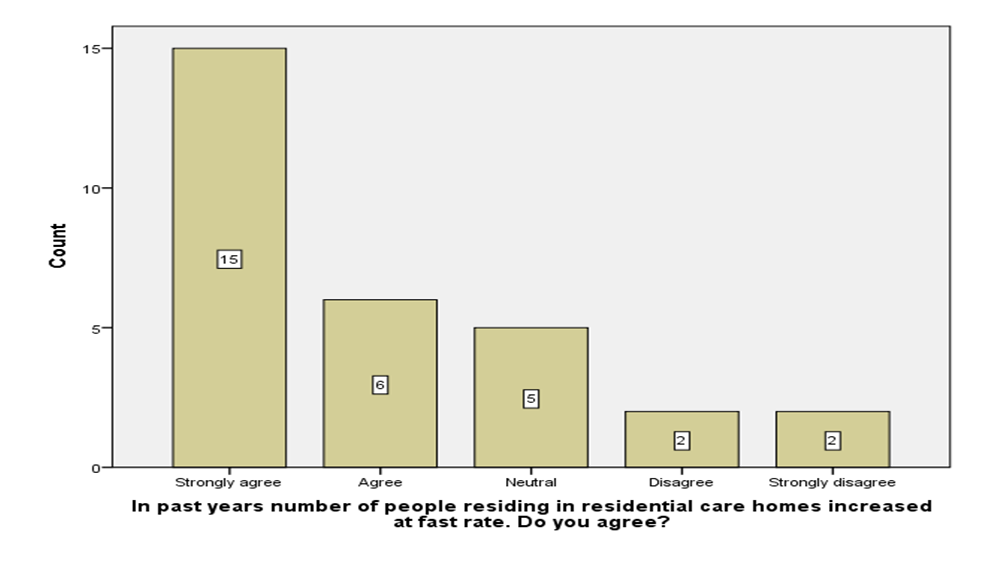
Chart indicate that there are 15 respondents are strongly agree and 6 respondents are agree with same fact. There are 5 respondents who are neutral, followed by 3 who disagree and 2 who strongly disagree. Hence, it can be said that most of the respondents agree with the fact that in past years the number of respondents definitely increased.
|
In the future, better earning opportunities will be available to luxury residential care homes? |
|||||
|
Frequency |
Percent |
Valid Percent |
Cumulative Percent |
||
|
Valid |
Strongly agree |
12 |
40.0 |
40.0 |
40.0 |
|
Agree |
8 |
26.7 |
26.7 |
66.7 |
|
|
Neutral |
3 |
10.0 |
10.0 |
76.7 |
|
|
Disagree |
4 |
13.3 |
13.3 |
90.0 |
|
|
Strongly disagree |
3 |
10.0 |
10.0 |
100.0 |
|
|
Total |
30 |
100.0 |
100.0 |
||
Interpretation
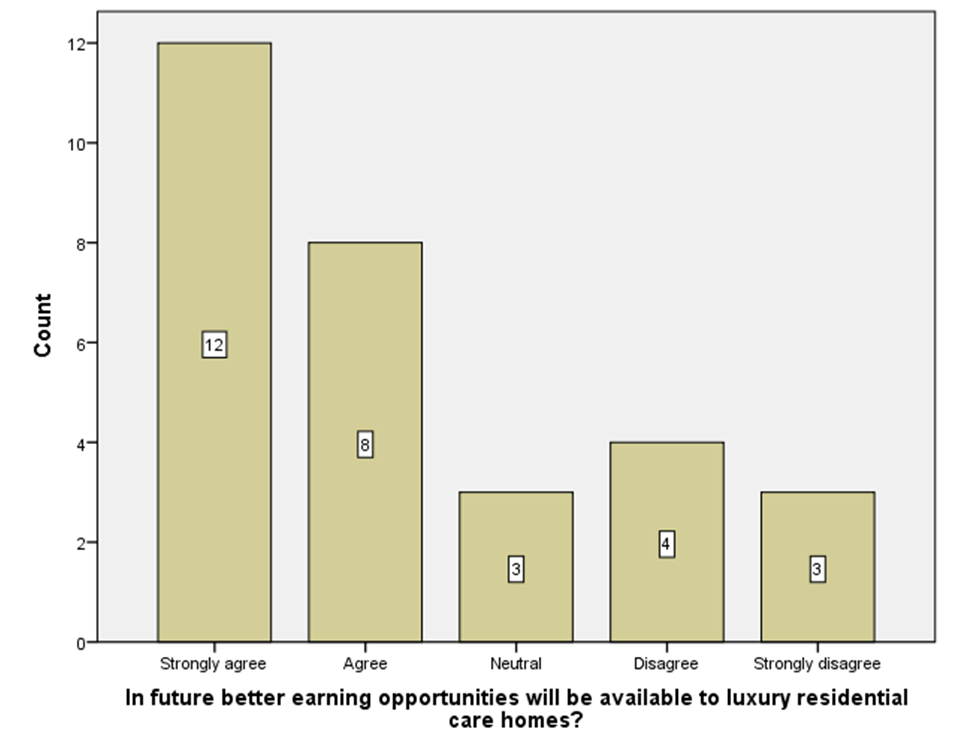
20 respondents agree, and few disagree, which reflects that there is consensus that better earning opportunities will be available to luxury residential care homes.
|
Which factor do you consider while selecting any luxury residential care home? |
|||||
|
Frequency |
Percent |
Valid Percent |
Cumulative Percent |
||
|
Valid |
Price |
9 |
30.0 |
30.0 |
30.0 |
|
Quality that is observed in residential care homes |
6 |
20.0 |
20.0 |
50.0 |
|
|
Both |
7 |
23.3 |
23.3 |
73.3 |
|
|
Positive word of moth marketing |
8 |
26.7 |
26.7 |
100.0 |
|
|
Total |
30 |
100.0 |
100.0 |
||
Interpretation
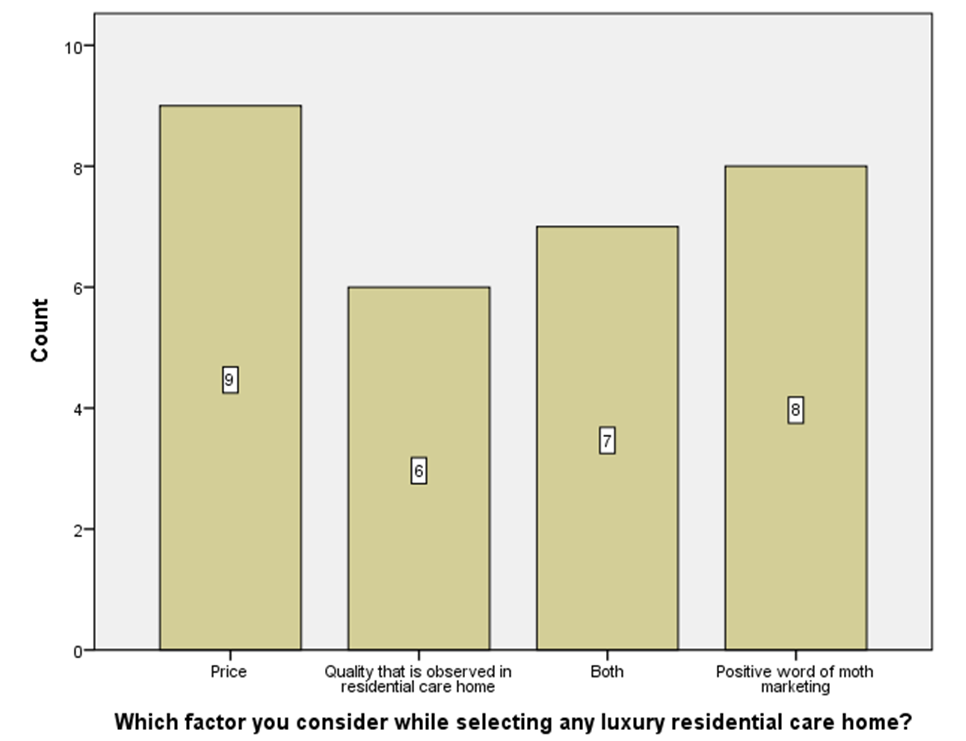
9 respondents give priority to price followed by 6 to quality and 7 respondents give importance to both while selecting any residential care home. There are 8 respondents that consider positive word of mouth marketing while considering any residential care home.
|
Do you agree that in respect to luxury feature in future more alternatives may appear in front of relevant people? |
|||||
|
Frequency |
Percent |
Valid Percent |
Cumulative Percent |
||
|
Valid |
Strongly agree |
13 |
43.3 |
43.3 |
43.3 |
|
Agree |
7 |
23.3 |
23.3 |
66.7 |
|
|
Neutral |
5 |
16.7 |
16.7 |
83.3 |
|
|
Disagree |
3 |
10.0 |
10.0 |
93.3 |
|
|
Strongly disagree |
2 |
6.7 |
6.7 |
100.0 |
|
|
Total |
30 |
100.0 |
100.0 |
||
Interpretation
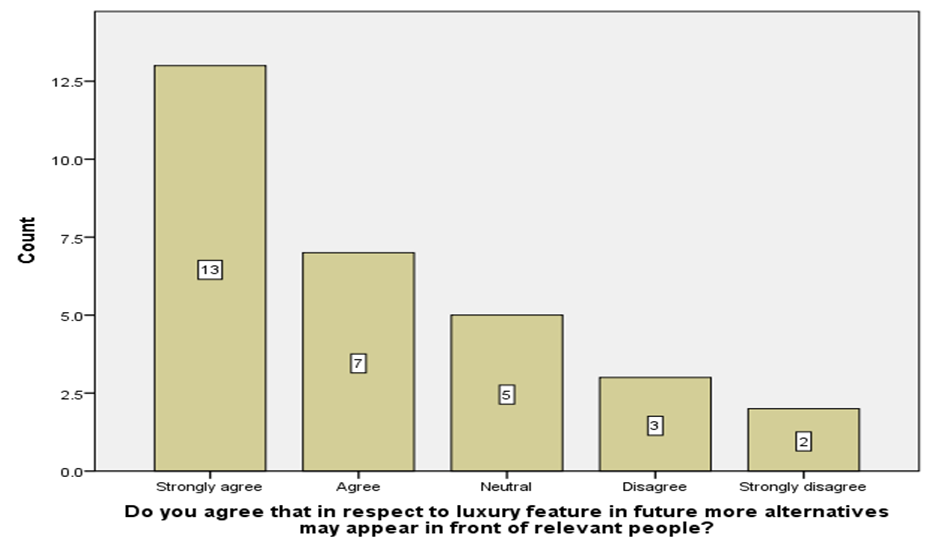
Chart is indicating that majority of respondents are agree on fact that in future more and more luxury residential care homes will comes in existence. Hence, competition will become more intense.
H0: There is no significant impact of quality of support service given by staff on earning opportunity that is available to individuals.
H1: There is significant impact of quality of support service given by staff on earning opportunity that is available to individuals.
|
Variables Entered/Removeda |
|||
|
Model |
Variables Entered |
Variables Removed |
Method |
|
1 |
Excellent quality of service support is given by staff members in luxury residential care homes.b |
. |
Enter |
|
a. Dependent Variable: In future better earning opportunities will be available to luxury residential care homes? |
|||
|
b. All requested variables entered. |
|||
|
Model Summary |
||||
|
Model |
R |
R Square |
Adjusted R Square |
Std. Error of the Estimate |
|
1 |
.356a |
.127 |
.095 |
1.320 |
|
a. Predictors: (Constant), Excellent quality of service support is given by staff members in luxury residential care homes. |
||||
|
ANOVAa |
||||||
|
Model |
Sum of Squares |
df |
Mean Square |
F |
Sig. |
|
|
1 |
Regression |
7.078 |
1 |
7.078 |
4.062 |
.054b |
|
Residual |
48.789 |
28 |
1.742 |
|||
|
Total |
55.867 |
29 |
||||
|
a. Dependent Variable: In future better earning opportunities will be available to luxury residential care homes? |
||||||
|
b. Predictors: (Constant), Excellent quality of service support is given by staff members in luxury residential care homes. |
||||||
|
Coefficientsa |
||||||
|
Model |
Unstandardized Coefficients |
Standardized Coefficients |
t |
Sig. |
||
|
B |
Std. Error |
Beta |
||||
|
1 |
(Constant) |
1.503 |
.449 |
3.349 |
.002 |
|
|
Excellent quality of service support is given by staff members in luxury residential care homes. |
.347 |
.172 |
.356 |
2.015 |
.054 |
|
|
a. Dependent Variable: In future better earning opportunities will be available to luxury residential care homes? |
||||||
Interpretation
Table given above reflect that value of level of significence is 0.05=0.05 which means that availability of excellent quality of service have significent impact on earning opportunity available to individuals. R value is 0.365 and same of R square is 0.127 which means that dependent and independent variable having low correlation with each other and with change in dependent variable 12% change comes in dependent variable. Cofficient value is 1.40 which reflct that with change in quality of service by single unit 1.40 units change comes in value of variable earning opportunity. Hence, alternative hypothesis accepted.
H0: There is no significant impact of failure of residential care home in providing services on recommendation of social care setting by people.
H1: There is significant impact of failure of residential care home in providing services on recommendation of social care setting by people.
|
Variables Entered/Removeda |
|||
|
Model |
Variables Entered |
Variables Removed |
Method |
|
1 |
Do you agree with fact that there are many luxury residential care homes that failed to provide services upto expected level.b |
. |
Enter |
|
a. Dependent Variable: If service provide by luxury residential care home is of good quality not excellent then also it is recommend by people to each other? |
|||
|
b. All requested variables entered. |
|||
|
Model Summary |
||||
|
Model |
R |
R Square |
Adjusted R Square |
Std. Error of the Estimate |
|
1 |
.309a |
.096 |
.063 |
1.311 |
|
a. Predictors: (Constant), Do you agree with fact that there are many luxury residential care homes that failed to provide services upto expected level. |
||||
|
ANOVAa |
||||||
|
Model |
Sum of Squares |
df |
Mean Square |
F |
Sig. |
|
|
1 |
Regression |
5.085 |
1 |
5.085 |
2.959 |
.096b |
|
Residual |
48.115 |
28 |
1.718 |
|||
|
Total |
53.200 |
29 |
||||
|
a. Dependent Variable: If service provide by luxury residential care home is of good quality not excelent then also it is recommend by people to each other? |
||||||
|
b. Predictors: (Constant), Do you agree with fact that there are many luxury residential care homes that failed to provide services upto expected level. |
||||||
|
Coefficientsa |
||||||
|
Model |
Unstandardized Coefficients |
Standardized Coefficients |
t |
Sig. |
||
|
B |
Std. Error |
Beta |
||||
|
1 |
(Constant) |
3.447 |
.548 |
6.294 |
.000 |
|
|
Do you agree with fact that there are many luxury residential care homes that failed to provide services upto expected level. |
-.254 |
.148 |
-.309 |
-1.720 |
.096 |
|
|
a. Dependent Variable: If service provide by luxury residential care home is of good quality not excelent then also it is recommend by people to each other? |
||||||
Interpretation
Table given above is indicating that value of level of significance is 0.09>0.05 which means that with change in independent variable significant difference does not comes in dependent variable. R and R square value is 0.309 and 0.096 which means that with change in IV which is failure of residential care home to provide services to customers moderate change comes in recommendation that people will made about luxury residential care home. Only 9% change comes in dependent variable with change in independent variable. Hence, it can be said that with change in IV 9% change comes in dependent variable. Null hypothesis accepted.
H0: There is no significant impact of increase in number of people in residential care home on availability of earning opportunity.
H1: There is no significant impact of increase in number of people in residential care home on availability of earning opportunity.
|
Variables Entered/Removeda |
|||
|
Model |
Variables Entered |
Variables Removed |
Method |
|
1 |
In past years number of people residing in residential care homes increased at fast rate. Do you agree?b |
. |
Enter |
|
a. Dependent Variable: In future better earning opportunities will be available to luxury residential care homes? |
|||
|
b. All requested variables entered. |
|||
|
Model Summary |
||||
|
Model |
R |
R Square |
Adjusted R Square |
Std. Error of the Estimate |
|
1 |
.493a |
.243 |
.216 |
1.229 |
|
a. Predictors: (Constant), In past years number of people residing in residential care homes increased at fast rate. Do you agree? |
||||
|
ANOVAa |
||||||
|
Model |
Sum of Squares |
df |
Mean Square |
F |
Sig. |
|
|
1 |
Regression |
13.587 |
1 |
13.587 |
8.998 |
.006b |
|
Residual |
42.280 |
28 |
1.510 |
|||
|
Total |
55.867 |
29 |
||||
|
a. Dependent Variable: In future better earning opportunities will be available to luxury residential care homes? |
||||||
|
b. Predictors: (Constant), In past years number of people residing in residential care homes increased at fast rate. Do you agree? |
||||||
|
Coefficientsa |
||||||
|
Model |
Unstandardized Coefficients |
Standardized Coefficients |
t |
Sig. |
||
|
B |
Std. Error |
Beta |
||||
|
1 |
(Constant) |
1.180 |
.426 |
2.768 |
.010 |
|
|
In past years number of people residing in residential care homes increased at fast rate. Do you agree? |
.543 |
.181 |
.493 |
3.000 |
.006 |
|
|
a. Dependent Variable: In future better earning opportunities will be available to luxury residential care homes? |
||||||
Interpretation
Results reflect that value of level of significence is 0.006
Use of software for making business decisions
SPSS software is used for analysis purpose as all statistical tests and charts are prepared on it. By analyzing all tables useful facts are identified that will assist decisions makers in developing insights about current situation that is in market.
Risk factor for luxury care home and mitigation
- Charging of penalty in case of failure to comply with law. In this regard good governance system can be developed at workplace.
- Increase in number of competitors. As mitigation strategy continue service improvement can be done.
- Technology upgradation adopted by rivals. In this regard regularly current technology base can be updated by the residential care home.
COCNCLUSION
On basis of above discussion it is concluded that there is significent importance of statistical tools for the firms. There are lot of scope in residential care homes business as there are high growth prospects but providing good quality of service to customers is inevitable to earn good quality of profit in the business. From luxury residential care homes individuals need different sort of services like Spa facility and attractive rooms etc.
REFERENCES
Books and journals
- Chan, Z.C., Fung, Y.L. and Chien, W.T., 2013. Bracketing in phenomenology: Only undertaken in the data collection and analysis process?. The Qualitative Report. 18(30). p.1.
- Gordon, A.L. and et.al., 2013. Health status of UK care home residents: a cohort study. Age and ageing. 43(1). pp.97-103.
- Hosmer, D.W., Lemeshow, S. and May, S., 2011. Applied survival analysis. Wiley Blackwell.
- Karkala, D. and Yalavarthy, P.K., 2012. Dataâ€resolution based optimization of the dataâ€collection strategy for near infrared diffuse optical tomography. Medical physics. 39(8). pp.4715-4725.
- Sahota, O., Morgan, N. and Moran, C.G., 2012. The direct cost of acute hip fracture care in care home residents in the UK. Osteoporosis International. 23(3). pp.917-920.
Online
- How to Conduct a Successful Focus Group Discussion, 2017. [Online]. Available through:<https://blog.socialcops.com/academy/resources/conduct-successful-focus-group-discussion/>.