
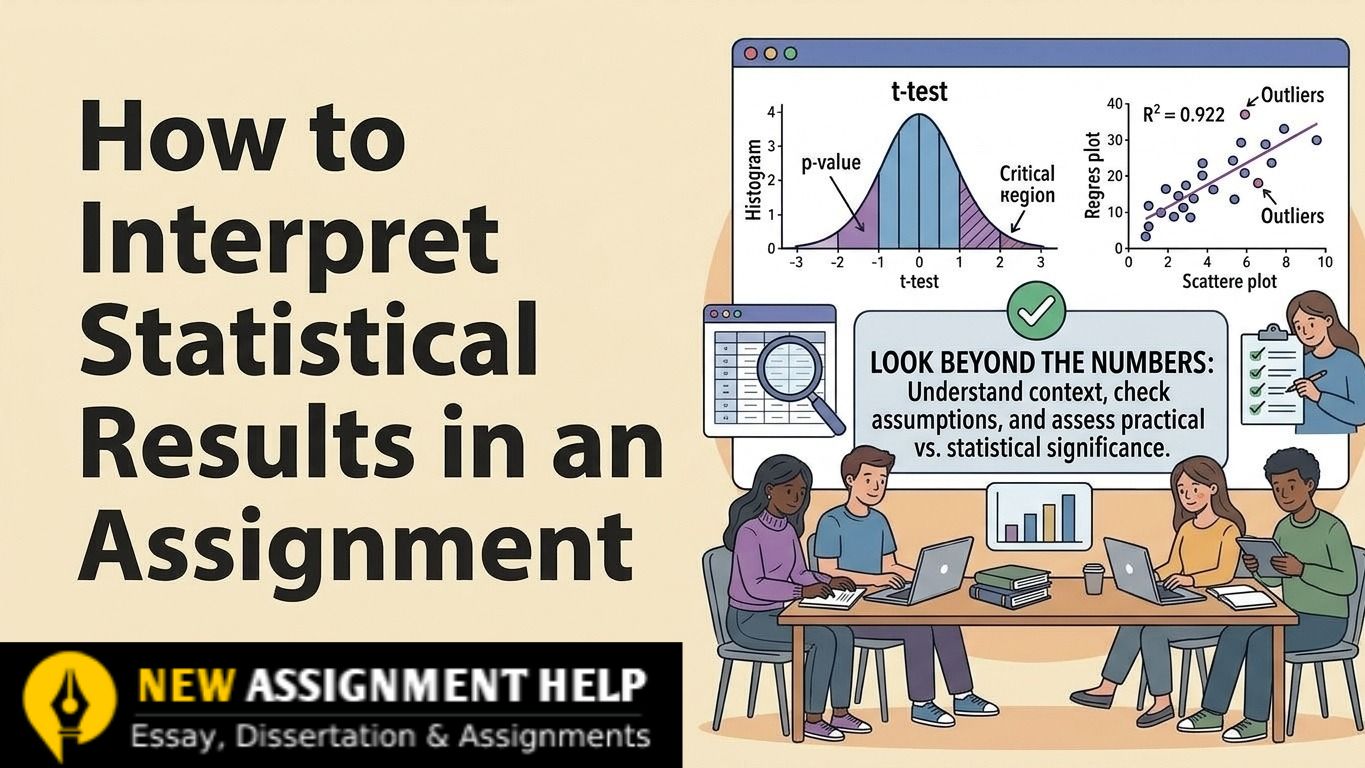
How to Interpret Statistical Results in an Assignment
- How to Interpret Statistical Results in an Assignment: Turning Numbers into Marks
- What does it mean to interpret results?
- How do I turn statistical output into a sentence?
- What does a p-value actually tell?
- What do confidence intervals and effect size add?
- What does a good interpretation look like for common tests?
- What mistakes lose marks in interpretation?
- Where does interpretation go: results or discussion?
How to Interpret Statistical Results in an Assignment: Turning Numbers into Marks
You need to interpret statistical results in an assignment, but the output just looks like a wall of numbers. If this sounds familiar, then you are not the only one. Running a statistical test is the easy part. But explaining it is where the marks actually lie. So in this guide, you will learn to connect the numbers directly to your research question with UK-style examples that you can adapt for your own work. So, let's start with what interpreting results actually means.
What does it mean to interpret results?
Interpreting statistical results refers to the explanation of raw numbers in plain words and what your numbers say about your research question. In simple language, it involves test values and probabilities from a data analysis and describing them in a clear and practical conclusion.
Markers award this type of interpretation the most rather than copied software output. A pasted table shows you can run a test. However, a good sentence shows you understand it. So how do you turn a table of numbers into a sentence? Let's find this out in the next section.
How do I turn statistical output into a sentence?
To turn statistical output into clear wording, you have to follow a structured formula that moves from the plain English conclusion to the exact numbers. So use this three-step procedure:
- Finding: What did you see?
- Evidence: Which numbers back it up?
- Meaning: What does it tell us about your question?
Here is an illustrative example using hypothetical house-price data:
“Houses in London were more expensive than houses in the Northeast (finding). The average price was £545,000 in London and £165,000 in the North East, p < 0.001 (evidence). This suggests that region is linked to house prices in this sample (meaning).”
The formula works the same in case you are using SPSS, R, Excel, or Minitab. Only the output layout will be changed. Next, look at the number that students find most confusing.
What does a p-value actually tell?
A p-value measures how compatible your observed data, or more extreme data, are with the null hypothesis, assuming the statistical model and its assumptions hold. A small p-value means your data would be unusual in that case.
Many modules use p < 0.05 as a common cut-off. It is a guide, not a magic line. A p-value of 0.049 is not very different from 0.051.
Also, be careful. A p-value does not say your result is true. It does not say your result is important either. It only tells you how well your data fits the idea of “no effect". To judge size and importance, you need two more tools.
What do confidence intervals and effect size add?
They show the magnitude of your result and how sure you can be about it. Effect size tells you the size of the difference or link and answers “how much” in your hypothesis. A confidence interval gives a range of likely values which specify “how sure”.
Here is why this matters. Imagine a huge study finds that a revision app raises marks by just 0.1 out of 100. The result could be statistically significant, but it is tiny. Significant does not always mean important.
One thing to remember: in a two-sided test, if a 95% confidence interval for a difference does not include zero, the p-value will be under 0.05. They tell the same story in two different ways.
What does a good interpretation look like for common tests?
A good statistical interpretation requires you to move past raw computer output to explain what the test measured, the strength and direction of the effect, uncertainty (confidence intervals), and practical or clinical relevance. Use these fill-in sentences as a starting point. Replace the blanks with your results, and you will result in a correctly interpreted statistical result.
| Test | Fill-in sentence | UK-based example |
|---|---|---|
| t-test | “Group A (M = __) scored higher than Group B (M = ), t() = __, p = __.” | Students who used the library vs. those who did not |
| Correlation | “There was a __ (weak, moderate, strong) __ (positive, negative) link between X and Y, r = __, p = __.” | Weekly study hours and exam marks |
| Regression | “Each extra __ was linked with a £__ change in __, holding other factors constant, p = __.” | Each extra bedroom and house price |
| Chi-square | “There was a link between __ and χ²() = __, p = __.” | Living at home and commute length |
What mistakes lose marks in interpretation?
- Saying "proves". Use “suggests” or “supports” instead. Data rarely proves anything on its own.
- Mixing up correlation and causation. A link between two things does not mean one causes the other. Say “linked to", not “caused by".
- Ignoring sample size. Small samples give shaky results. Mention your sample size and its limits.
- Pasting output with no explanation. Always add a sentence that says what the table means.
Where does interpretation go: results or discussion?
In most cases, report the numbers in your results section and explain what they mean in your discussion. This can change by module, though. Check your assignment brief and marking criteria before you write every single point. Some tutors want a short interpretation in the results too. Thus, go with what your university requires, and you are all set with the best statistical interpretation.
When you are writing a statistical interpretation, just remember the formula: finding, evidence, meaning. Say what you have analysed, show the numbers, and explain why it matters in your assignment. You can also take statistics assignment guidance as additional support.

 10 | PhD in Statistics
Dr Harriet Calloway is a statistics tutor and academic writer based in Manchester centre of New Assignment Help UK. She holds a PhD in Applied Statistics and has spent over ten years helping undergraduate and postgraduate students understand data analysis. Her teaching covers hypothesis testing, regression, ANOVA and choosing the right statistical test, using SPSS, R and Excel. Harriet has supported thousands of UK university students in writing clear, well-structured assignments and interpreting results with confidence. She is especially interested in explaining difficult ideas in plain language, so students can show real understanding rather than just correct answers. Her guides follow UK university marking criteria and current academic standards, which benefit students the most.