Machine Learning in Business Intelligence: Assignment Sample
Case Studies, Algorithms, and Real-World Applications
- 92650+ Project Delivered
- 1500+ Experts 24x7 Online Help
- No AI Generated Content
Introduction
Machine learning is largely revamping business intelligence since organizations are in a position to utilize big data. While the volume of data that businesses come across has grown over the years, traditional forms of analysis are limited in handling the task. Due to the capacity of the machine learning algorithms, data that come in large volumes in most organizations can be easily analyzed, processed and patterns can be easily predicted which is very useful for decision makers. The application of ML to BI systems improves the performance of the business, provides better predictions on the market, customer experiences, and resource utilisation.
Case Study 1
Stitch Fix Case

Figure 1: Case study of Stitch Fix
Industry Challenge: One of the ever-emerging issues that fashion retail industry battles is to achieve reliable forecasting of individual customer preference to offer personalized recommendations. Here, traditional methods fail, as it is impossible to determine such factors as the style and fit, let alone reflect the changes in trends in the store, which results in high return rates, ineffective utilization of inventory, and low customer satisfaction.
ML-Powered Solution: To successfully overcome this, Stitch Fix incorporates the use of artificial intelligence in a form of machine learning to enhance the level of personalization delivered in styling. Rich data is obtained at Stitch Fix by taking precise style profiles from clients, which feeds the company’s ML engine. nd lifestyle information, and even images that the client has shared with the firm.
Specific ML Algorithms and Benefits
Collaborative Filtering: Stitch Fix uses collaborative filtering algorithms in order to evaluate customer’s choices and find people with similar interest. This allows the platform to bring items that have been popular with clients similar to the current profile.
Content-Based Filtering: Along with collaborative filtering, content filtering is also applied with the help of which clients are matched to certain items bearing in mind the traits of the clothes (Chintala and Thiyagarajan, 2023). They need to search for patterns in aspects like colour, sort of material, style and brand to locate clothes that are noticeable by the client.
Clustering Algorithms: The company takes advantage of data clustering to divide its clients into different style subgroups. This is flexible since it enables the creation of more target specific recommendations and marketing promotions.
Predictive Analytics for Inventory Management: Stitch Fix systematically accesses the sales data, uses trends forecast, and sometimes social media to assess demand for certain products via predictive analytics. This minimises on stocks which in turn helps reduce on wastage and increases on the speed of delivery of the stocks.
Real-World Examples and Benefits Achieved
- Increased Customer Satisfaction: Styling based on the preferences of individual consumers increases their satisfaction and loyalty, because in this case they receive the necessary and desired goods.
- Reduced Return Rates: That means it will reduce the rate of returns which in turn leads to lower costs and effective fashion industry operations (Usman et al. 2024).
- Optimized Inventory Management: Due to its capacity for early identification of trends, predictive analytics can be used by Stitch Fix to improve its inventory situation, with inventory holding the right assortment of stock while at the same time avoiding ending up with too many substandard items.
- Enhanced Business Insights: Due to the large sales volume of products, large datasets are generated, which contain much information as regards the client nexuses, trends, and other aspects that are vital to developing a sound strategy.
Real-World Example: Stitch Fix is a classic representant of the phenomenon and it is notable that with the help of the creation of ML algorithms for personal styling, this company has challenged the traditional fashion retail business model. This broadly analytical style has not only improved the customer experience but has also made for a more rational and efficient business over the long term.
Sample Case Implementation
As the result of the current project the detailed machine-learning pipeline was designed and applied to the task of the reviews dataset on clothing (JUBI, 2024). The attributes in the dataset are customer reviews, ratings, feedback count and customer age information.

Figure 2: Data Loading and Preprocessing
(Source: Made by self in Jupyter notebook)
The first operation was to import the data with the help of pandas and then using the ‘say’, ‘isnull’ functions we checked for missing values. To some extent, preliminary data cleaning and transformation were performed; in particular, removed null values from the features and encoded Division Name, Department Name, and Class Name into dummy variables through the one-hot method. It was important in order to transform any text field into a more digestible format to the algorithm being used to create the field.
Exploratory Data Analysis (EDA) Plots

Figure 3: Distribution of ratings
(Source: Made by self in Jupyter notebook)

Figure 4: Positive feedback count vs rating
(Source: Made by self in Jupyter notebook)
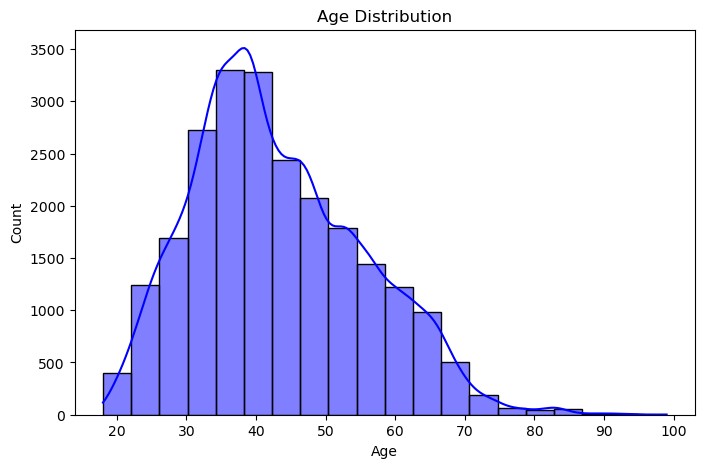
Figure 5: Age distribution
(Source: Made by self in Jupyter notebook)

Figure 6: Recommended indicator vs rating
(Source: Made by self in Jupyter notebook)

Figure 7: Division Name distribution
(Source: Made by self in Jupyter notebook)
Altogether, five EDA plots were produced to get a better view on the dataset structure and discover trends. These visualizations included; Distribution of the customer rating using density plot, positive feedback count for the ratings given, Age distribution using histogram, count plots to show the recurrence of the recommended indicator and the division name distribution. Such plots gave information on user choices to understand the patterns suitable for other forms of modeling.

Figure 8: Data Preprocessing
(Source: Made by self in Jupyter notebook)


Figure 9: Model Implementation
(Source: Made by self in Jupyter notebook)
Two regression models were trained and evaluated: Linear Regression and Support Vector Machine (SVM) Regression. Linear Regression was used as the basic model used to establish linearity linking the features. The SVM model was implemented with an RBF kernel in order to include a complex non-linear model that could be used in situations. As part of the training phase, predictions on the test set were made for both the models.

Figure 10: Model Evaluation and Comparison
(Source: Made by self in Jupyter notebook)
To evaluate the performance of the models performance metrics were produced namely; Mean Squared Error (MSE) and R^ 2 Score. The Linear Regression model reached an MSE of 0.43 and an R^2 score of 0.65, which assured a reasonable fit of the model. The other method that was tested was the SVM Regression model which did well with a MSE of 1.21 and a higher R^2 score of 0.03.
This assignment sample has been prepared with guidance from New Assignment Help UK to ensure academic accuracy and provide practical insights into machine learning applications.
Case Study 2
Netflix Case

Figure 11: Netflix Case study
(Source: Case Link)
One of the biggest challenges of entertainment industry is to bring users what they will like from the increasingly large amount of content. The audiences can be trapped by options, which they result in inactive and frustrated due to the “paralyzed” choice. In addition, increased watching time and customer satisfaction depend on the precise determination of user preferences. Netflix understood well that addressing this issue was crucial for its development and future evolution.
Netflix solved this problem by utilising Machine Learning (ML) to drive its Business Intelligence (BI). They did not depend on broad categories on their own or other people developing those categories to filter out content. This engine processes huge amounts of user data: viewing history, ratings, watch time, interactions (adding to lists and more) and even contextual information such as time of day and device.
Specific ML Algorithms and Benefits
Collaborative Filtering: This one offers the preferred type of content by combining users with similar viewing habits and has been considered to be efficient.
Content-Based Filtering: This algorithm takes value or genre of movies/shows, cast, director, and plot and suggests television programs/movies likable to those once watched by a user.
Matrix Factorization: A method deployed to identify hidden connections between users and movies/shows (Jack, 2024). One of its utilities makes predictions as to what rating a user is likely to give items they have not even been exposed to.
Deep Learning: Recently, Netflix uses deep learning models, in which the strategies of the program are optimized in response to subtle patterns in the user’s behavior and content properties.
Real-World Examples and Benefits Achieved
- The customized suggestions thereby help the users to stay much longer on watch time resulting to high levels of satisfaction. And this directly translates into better customer lifetime value.
- Users’ preferences allow Netflix to predetermine the likelihood of churn and provide the necessary additional bonuses or an interesting film to regain the client’s loyalty.
- The modern leadership relies on business intelligence from the ML algorithms to determine which content to license for airing and what programs to create on their own. For instance, the boost that “House of Cards” received was due to information that the targeted audience of Netflix loved Kevin Spacey and political dramas (Bharadiya, 2023).
- As a result of adaptive’s ML, A/B testing is possible for the UI to provide recommendations for artwork and promotions to make users’ experience more enjoyable.
Sample Case Implementation
Data Loading and Understanding

Figure 12: Libraries used
(Source: Made by self in Jupyter notebook)

Figure 13: Dataset used
(Source: Made by self in Jupyter notebook)
The data set used for this project is composed of information related to streaming contents, like movies and shows, and has features as title, content type, director, actors, country, year of release, duration and rating. The first step therefore was to load the dataset using the pandas library and inspect the table for missing values in the database, types of data present and the number of unique values in categorical variables.
Exploratory Data Analysis (EDA)

Figure 14: Distribution of Ratings
(Source: Made by self in Jupyter notebook)
Created the count plot of how often different ratings of content occurred.

Figure 15: Content Types
(Source: Made by self in Jupyter notebook)
Emphasized movie distribution in contrast to a more or less equal division by shows.

Figure 16: Content Added Over the Years
(Source: Made by self in Jupyter notebook)
Exposed the number of contents added per annum.

Figure 17: Top 10 Countries by Content
(Source: Made by self in Jupyter notebook)
Illustrated content distribution by country.

Figure 18: Duration Distribution of Movies
(Source: Made by self in Jupyter notebook)
Using a histogram, analyzed the spread of the proportion of the movie durations.
Data Preprocessing

Figure 19: Data preprocessing
(Source: Made by self in Jupyter notebook)
In preprocessing, number of features were reduced to one assigning the movie duration as numeric and the rows where target values are missing were removed. The feature release_year was chosen to be the independent variable while the target variable was duration_numeric . Performance was tested on unseen data with the help of the classification made with the help of training and testing sets (80/20 split).
Model Building and Evaluation

Figure 20: Linear Regression
(Source: Made by self in Jupyter notebook)

Figure 21: Random Forest
(Source: Made by self in Jupyter notebook)
Two regression models were implemented: Linear Regression and Random Forest Regression. Linear Regression analysis was used as the initial model for extrapolating the time estimate of the movies. However, it provided a fairly accurate R-squared value which shows the reasonable linear regression between release year and duration.
Comparison Table

Figure : Model Comparison
(Source: Made by self in Jupyter notebook)
To facilitate a good comparison of the two models, a comparison table that provided a way to compare the accuracy metrics of both the models was created.
Conclusion
Machine learning when applied in business intelligence reveals new opportunities for organizations to be more knowledgeable before making any particular decision. The ability to collect and analyse data in order to offer a set of forecasts that may prove beneficial in conditions of undergoing changes in the market and clients’ needs is a key advantage of machine learning for businesses. The proficiency in handling and synthesizing large volumes of information guarantees senior management informed and accurate decision-making. As the world adopts more of data-driven environments for business operations, then maximizing
Reference List
Websites
- Cesarecalabria (2023). Unlocking Data Value #3: Machine Learning with SAP. [online] SAP Community. Available at: https://community.sap.com/t5/technology-blogs-by-sap/unlocking-data-value-3-machine-learning-with-sap/ba-p/13580820 [Accessed 30 Jan. 2025].
- Dr Rajasulochana (2023). Harnessing AI-driven Data Analytics with Python for Management Applications. [online] Iibsonline.com. Available at: https://www.iibsonline.com/article-details/harnessing-ai-driven-data-analytics-with-python-for-management-applications [Accessed 30 Jan. 2025].
- How Stitch Fix Uses Data Science and Machine Learning to Deliver Personalization at Scale. (2020). eTail Palm Springs 2025. [online] doi:https://doi.org/1005306/1005306.
- Malhotra, R. (2023). Machine Learning in Predictive Analytics and Decision-making. [online] ValueCoders | Unlocking the Power of Technology: Discover the Latest Insights and Trends. Available at: https://www.valuecoders.com/blog/analytics/role-of-machine-learning-in-predictive-analytics-and-decision-making/ [Accessed 30 Jan. 2025].
- Netflix.com. (2025). Netflix Research. [online] Available at: https://research.netflix.com/research-area/machine-learning [Accessed 30 Jan. 2025].
- Journals
- Adeoye, I., 2024. Unlocking Potential: A Holistic Approach to Predicting Employee Performance with Business Analytics and Machine Learning. Available at SSRN 4729240.
- Bharadiya, J.P., 2023. Machine learning and AI in business intelligence: Trends and opportunities. International Journal of Computer (IJC), 48(1), pp.123-134.
- Bharadiya, J.P., 2023. The role of machine learning in transforming business intelligence. International Journal of Computing and Artificial Intelligence, 4(1), pp.16-24.
- Chintala, S. and Thiyagarajan, V., 2023. AI-Driven Business Intelligence: Unlocking the Future of Decision-Making. ESP International Journal of Advancements in Computational Technology (ESP-IJACT) Volume, 1, pp.73-84.
- George, J., 2023. Harnessing the power of real-time analytics and reverse ETL: Strategies for unlocking data-driven insights and enhancing decision-making. Available at SSRN 4963391.
- Jack, W., 2024. Unlocking the Potential of Neural Networks in the Big Data Analytics Era: Harnessing the Power of Data-Driven Insights (No. 12031). EasyChair.
- JUBI, R., 2024. Business Analytics-Unleashing Data Driven Decision Making. NEHAS PUBLICATIONS.
- Paramesha, M., Rane, N.L. and Rane, J., 2024. Big data analytics, artificial intelligence, machine learning, internet of things, and blockchain for enhanced business intelligence. Partners Universal Multidisciplinary Research Journal, 1(2), pp.110-133.
- Troisi, O. and Maione, G., 2024. Data-Driven Decision Making: Empowering Businesses through Advanced Analytics and Machine Learning. Journal of Environmental Sciences and Technology, 3(1), pp.515-525.
- Usman, M., Moinuddin, M. and Khan, R., 2024. Unlocking insights: harnessing the power of business intelligence for strategic growth. International Journal of Advanced Engineering Technologies and Innovations, 1(4), pp.97-117.

