
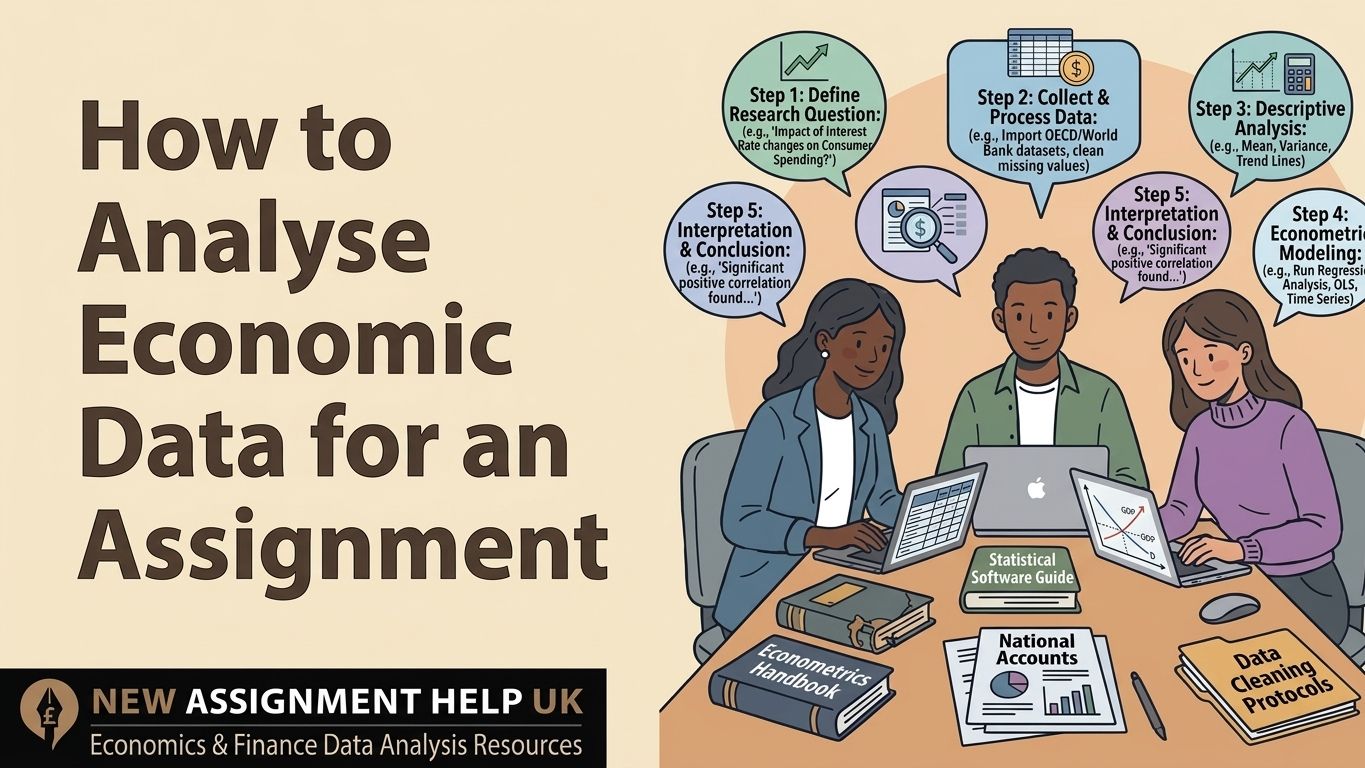
How to Analyse Economic Data for an Assignment
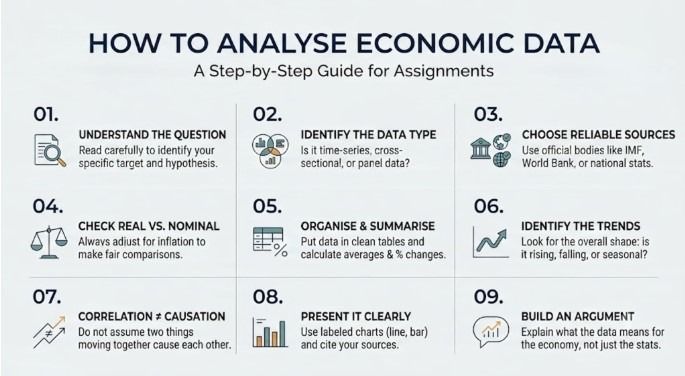
- Step 1: Understand What the Question and Hypothesis Are Really Asking
- Step 2: Analyse the Type of Data You're Working With
- Step 3: Get Your Data From a Reliable Source
- Step 4: Separate Real Values From Nominal Values
- Step 5: Organise and Summarise the Data
- Step 6: Look for Trends, Not Just Numbers
- Step 7: Don't Confuse Correlation With Causation
- Step 8: Present the Data Clearly
- Step 9: Turn Your Analysis Into an Argument
- Additional Tips to Avoid Mistakes
You've got a spreadsheet full of numbers and an assignment that says 'analyse the data', but what does that actually mean? For analysing economic data, you have to follow a structured process which involves source selection and descriptive statistics and requires economic reasoning. Once you understand the process, the rest can be done with less effort. So, let’s walk through the whole guide and build your next economic assignment with precision.
Step 1: Understand What the Question and Hypothesis Are Really Asking
Before you start anything, read the question twice. Are you being asked to describe a trend, compare two countries, or explain why something happened? Economic data can answer very different questions, so knowing your target keeps your whole assignment specific to the requirement. Write the question in your own words at the top of your page for more clarity. It sounds small, but it saves hours later.
Once you know what you're looking for, the next step is figuring out what kind of data you actually have.
Step 2: Analyse the Type of Data You're Working With
The data in economics usually comes in three forms:
- Time-series data: the same thing measured over a particular time interval, like inflation from 2015 to 2025.
- Cross-sectional data: in this data of different individuals or things are measured at one point in time, like unemployment across ten countries this year.
- Panel data: a mix of both.
Knowing which type you have will tell you how to read the question. A time-series chart specifies change over time. A cross-sectional table tells you about comparison.
With the data type sorted, you'll want to make sure the numbers themselves come from a source you can trust.
Step 3: Get Your Data From a Reliable Source
Always stick to official sources such as the World Bank, IMF, Eurostat, national statistics offices, or the Bureau of Labour Statistics to add value in your work. Before using any dataset, check three things: is it current, is it from an official body, and does it explain how the numbers were collected? This is also where you build good academic habits, since tutors look for
evidence-based sourcing, not just numbers pulled from a random webpage.
Step 4: Separate Real Values From Nominal Values
This trips up a lot of students. Nominal values are raw numbers, which are not adjusted for inflation. Whereas real values eliminate inflation, so you're comparing like with like. If wages rose by 5% but inflation rose by 6%, real wages actually fell. Always check which version of the data you're using before drawing conclusions.
Now that your numbers are trustworthy and properly adjusted, it's time to organise them so patterns become visible.
Step 5: Organise and Summarise the Data
Put your data into a clean table. Check for missing values or obvious errors. Then calculate a few basic descriptive figures such as:
- Mean (the average)
- Median (the middle value)
- Percentage change (how much something rose or fell)
For example, if unemployment moved from 4% to 6%, this is a 2 percentage point rise. Simple numbers like this give your analysis a solid foundation.
With the basics calculated, you're ready to look at the bigger picture the data is showing.
Step 6: Look for Trends, Not Just Numbers
Describe what the data is doing in simple words: rising, falling, staying flat, or moving up and down seasonally. A good analysis explains the shape of the data before jumping to conclusions.
While spotting patterns, keep one rule in mind, because it's where many assignments lose marks.
Step 7: Don't Confuse Correlation With Causation
Correlation means two economic variables move together, but causation means one variable directly causes a change in the other. Two things moving together doesn't mean one causes the other. Ice cream sales and drowning rates both rise in summer, but ice cream doesn't cause drowning. Heat causes both. So always ask if there's a third factor before claiming one thing caused another.
Once your analysis is solid, presenting it clearly matters just as much as the numbers themselves.
Step 8: Present the Data Clearly
Choose a line chart for trends over time and a bar chart for comparisons between groups. Then label your axes, give every chart a title, and cite the data source underneath. A clearly presented chart shows your tutor you understand the data, not just that you can copy numbers into Excel.
Finally, bring everything together into one clear argument.
Step 9: Turn Your Analysis Into an Argument
This is the step that earns the most marks and gets skipped the most. Don't just say "unemployment rose". Instead, explain what that means: for households, for government policy, or for the wider economy. Your analysis should build toward one clear point and must be backed by the data you've shown.
Additional Tips to Avoid Mistakes
- Using nominal data when real data was needed
- Mixing up correlation with causation
- Forgetting to name the data source
- Using outdated figures instead of the latest release
Analysing economic data isn't about knowing every statistical formula. It's about asking the right question, checking your source, understanding your numbers, and explaining what they mean. So follow these steps mentioned above in order, and your next project will feel far more manageable than it was ever before. Along with this, you can also seek economics assignment support for more clarity.
.jpg)
 6 Years | MSc Economics (Dist.), Econometrics
I have done my MSc Economics (Dist.), Econometrics from the prestigious University of the United Kingdom. I am an academic writer on the same subject. Students can choose me for their academic papers. I can write error-free and high-quality assignments, essays, and dissertations in the required time.